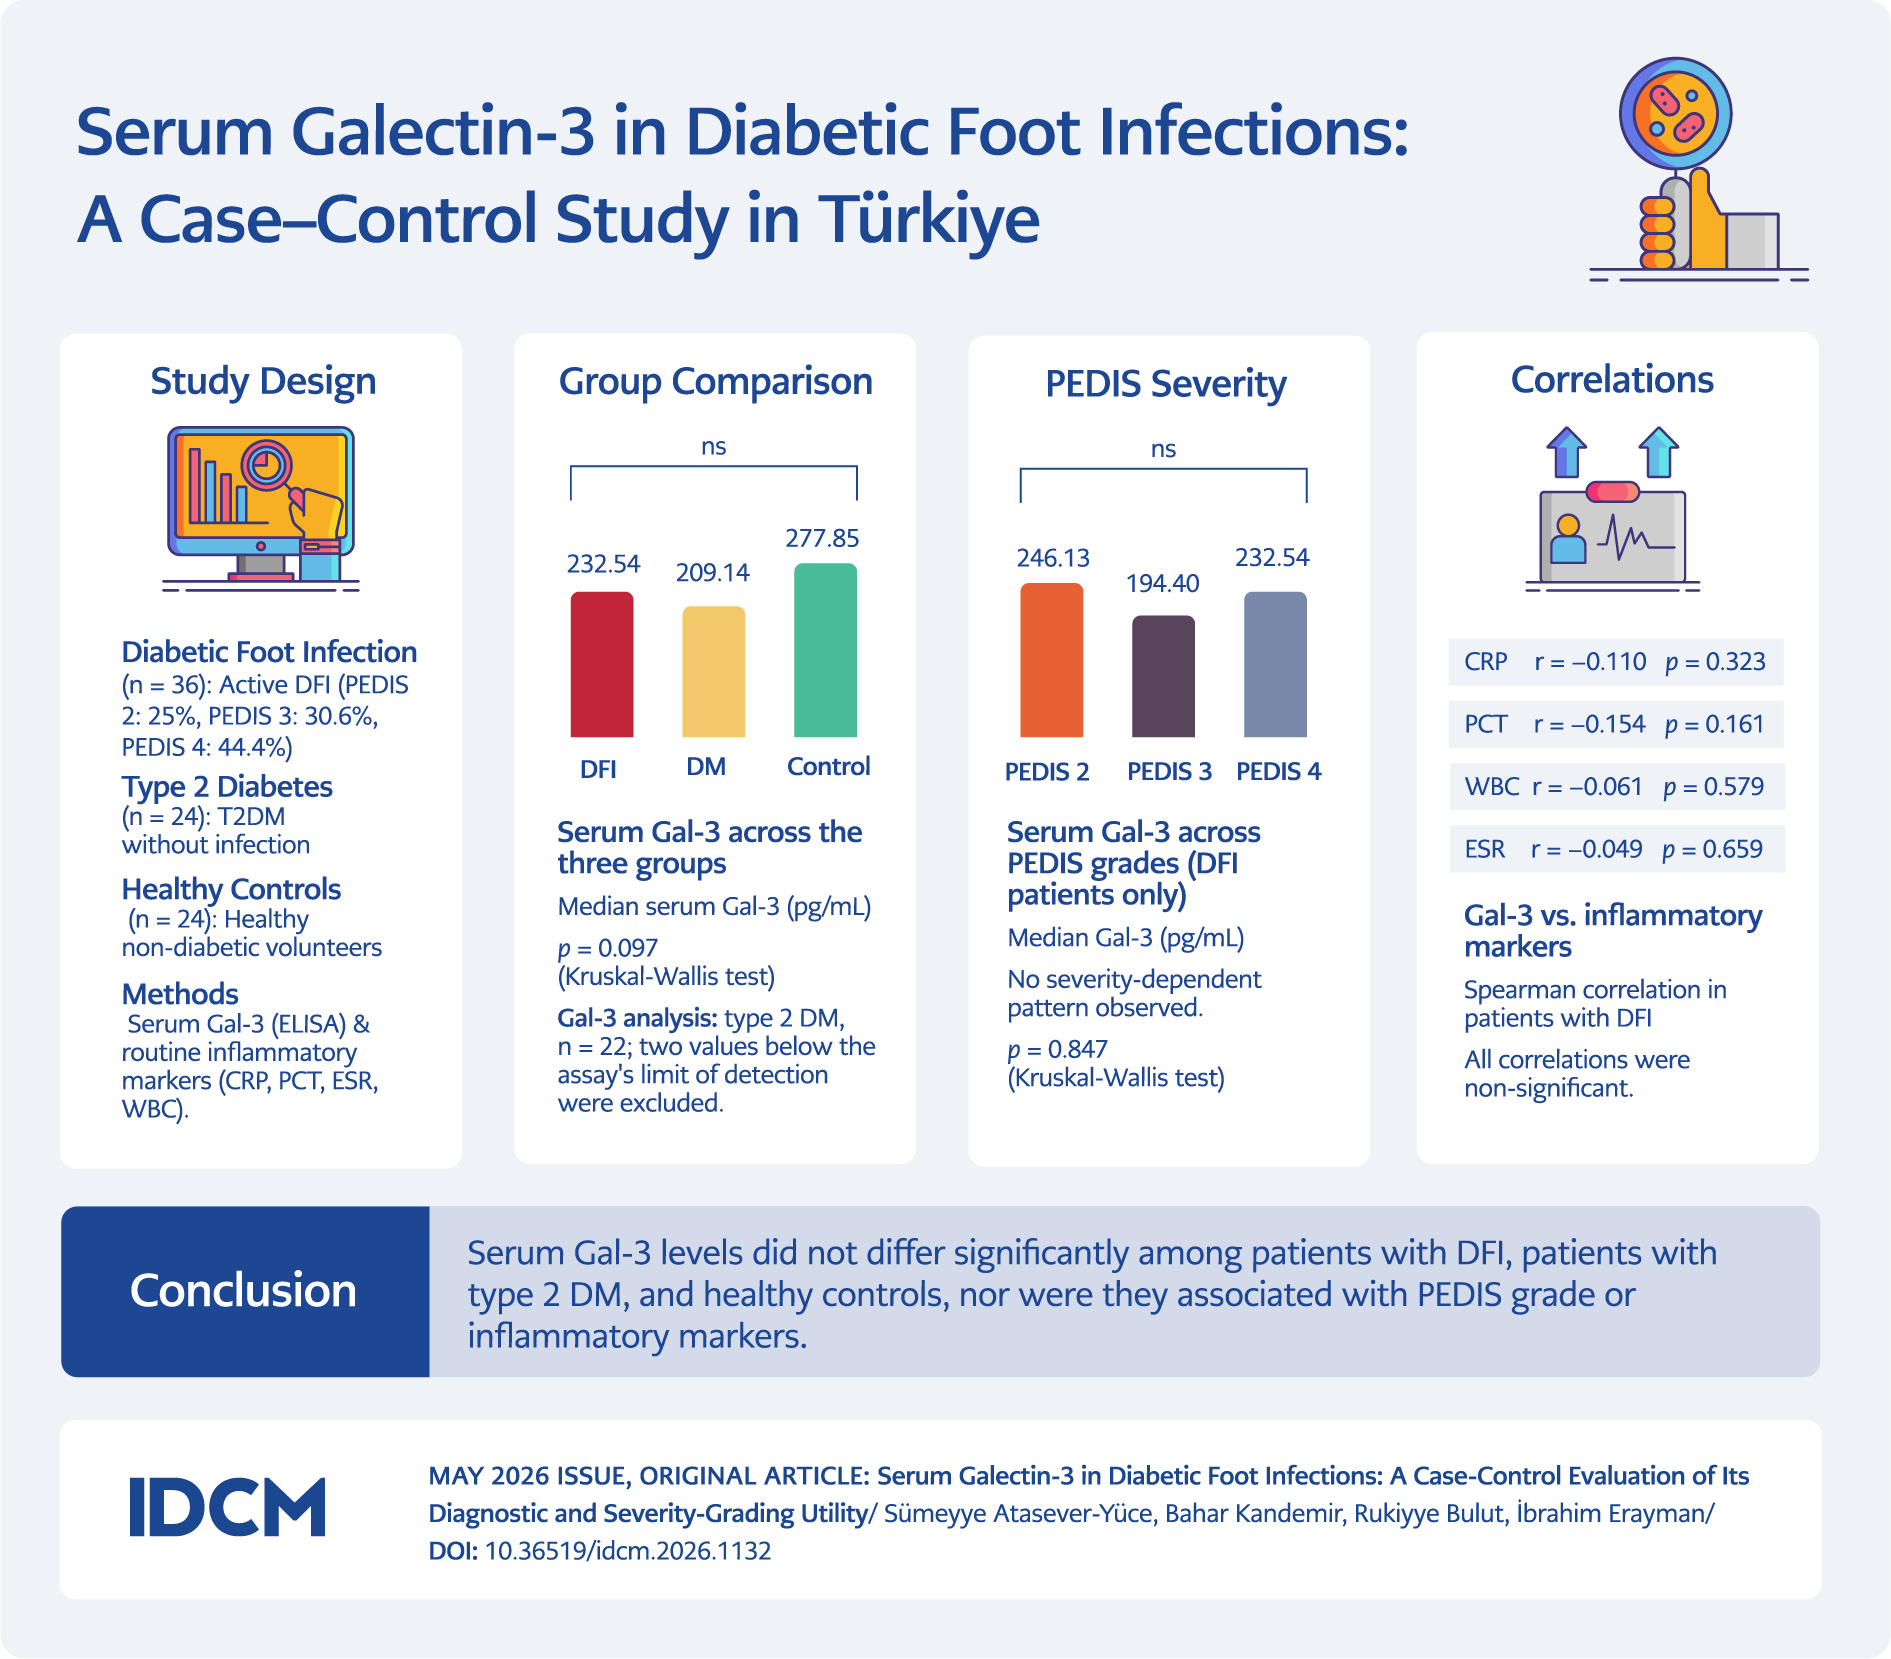
Graphical Abstract
Introduction
Galectin-3 (Gal-3) is a lectin belonging to the β-galactoside-binding lectin family and was first identified in macrophages (1,2). It is encoded by the LGALS3 gene on chromosome 14 (3). Like other galectins, Gal-3 exerts its effects by enabling galactose binding to glycoconjugates (4). Although initially identified in macrophages, Gal-3 has since been shown to be expressed in all tissues. Galectin-3 is synthesized in organs such as the small intestine, colonic epithelium, cornea, conjunctival epithelium, thymus, lung tissue, kidney, breast, and prostate, as well as in osteoblasts, osteoclasts, keratinocytes, Schwann cells, and endothelial cells (5).
Galectin-3 secretion also occurs in immune system cells, including neutrophils, eosinophils, mast cells, basophils, and Langerhans cells (2). Its primary role in the immune system is the induction of inflammation. It achieves these effects by acting on different immune system cells. In addition to increasing interleukin-1 (IL-1) production, it stimulates superoxide production by monocytes and neutrophils and promotes oxidative response and mediates the release of immune-related mediators from mast cells (5).
Galectin-3 exhibits antiapoptotic effects by binding to certain apoptotic ligands in the cytoplasm (6). It can also recognize galactose-containing glycoconjugates found on microorganisms (7,8).
Galectin-3 has been shown to exert angiogenic effects on endothelial cells (9). The role of Gal-3 in the pathogenesis of diabetes is considered to be revealed primarily through its effects on adipose tissue (10). Galectin-3 is a molecule that binds advanced glycation products. These products act as free radicals, causing endothelial disorders and microvascular complications, which are end-organ damage in diabetes (11). Recent studies also suggest that chronic inflammatory processes, such as complicated or uncomplicated diabetes and obesity, are closely related to Gal-3 levels (12).
This study aimed to investigate the relationship between Gal-3 levels and infection and inflammatory processes among patients with type 2 diabetes mellitus (DM), diabetic foot infection (DFI), and healthy controls.
Materials and Methods
After receiving ethics committee approval (2023/4564) and approval from our university’s scientific research projects board, individuals including patients with DFI, patients with type 2 DM without infection, and healthy controls without chronic comorbidities were included in the study after providing written informed consent on a voluntary basis.
Exclusion criteria were age younger than 18 years; a diagnosis of type 1 DM; the presence of any of the following chronic or inflammatory conditions known to potentially influence serum Gal-3 levels: chronic kidney disease, coronary artery disease, congestive heart failure, chronic liver disease, chronic obstructive pulmonary disease, asthma, autoimmune and connective tissue diseases, and active or previously treated malignancy; and any active infectious disease at a site other than the diabetic foot. Participants in all three groups were free of any chronic disease other than type 2 DM (in the DM and DFI groups); individuals with any of the conditions listed above—including congestive heart failure, autoimmune and connective tissue diseases, and malignancy—were not enrolled.
The control group comprised healthy adult volunteers recruited from hospital staff, patients’ relatives, and individuals attending our outpatient clinic. Absence of DM was confirmed by measurement of glycosylated hemoglobin (HbA1c) in all controls. The absence of active infection was verified by history, physical examination, and acute-phase reactants. None of the controls had any of the chronic or inflammatory conditions listed in the exclusion criteria; the absence of chronic disease was based on participant self-report. The exclusion criteria detailed above applied equally to all groups.
For all participants, age, sex, the number of years they had been diagnosed with diabetes, symptoms, physical examination findings, and body mass index (BMI) were recorded. In patients with type 2 DM and DFI, routinely measured levels of urea, creatinine, aspartate aminotransferase (AST), alanine aminotransferase (ALT), glucose, C-reactive protein (CRP), procalcitonin, erythrocyte sedimentation rate (ESR), HbA1c, and leukocyte counts were recorded. Patients known to have diabetes or those with plasma glucose >200 mg/dL or HbA1c level >6.5% at admission were evaluated for DFI. Patients were classified according to the perfusion, extent/size, depth/tissue loss, infection, and sensation (PEDIS) classification based on their medical history, physical examination findings, laboratory parameters, and radiologic findings. The diagnosis of cellulitis was based on the coexistence of clinical findings such as increased skin temperature during the acute phase, redness, edema, and erythema with ill-defined borders. The diagnosis of osteomyelitis was based on clinical findings such as a sausage-shaped digit and an ulcer deeper than 2 cm with a fistula extending to the skin, as well as imaging findings on direct radiography and magnetic resonance imaging (MRI). Wound or deep tissue culture results from patients with DFI were recorded.
Serum Galectin-3 Measurement
Serum Gal-3 levels were measured using a commercial sandwich enzyme-linked immunosorbent assay (ELISA) kit (Human Galectin-3 ELISA Kit, Catalog No. E1951Hu; Bioassay Technology Laboratory, Shanghai Korain Biotech Co., Ltd., Shanghai, China), according to the manufacturer’s instructions. The assay is based on a biotinylated anti-human Gal-3 antibody with a streptavidin-horseradish peroxidase (HRP) detection system. According to the manufacturer, the assay has a detection range of 5–2000 pg/mL and a sensitivity of 2.49 pg/mL, with a reported intra-assay coefficient of variation below 7%. Serum obtained from routine venous samples was collected in gel-separator tubes, centrifuged at 3000 rpm for 20 minutes, and stored at -80°C until analysis. Optical density was read at 450 nm using a microplate reader, and Gal-3 concentrations were derived from a standard curve generated for each assay run. All Gal-3 values are expressed in pg/mL.
Statistical Analysis
The data were analyzed using the Statistical Package for the Social Sciences (SPSS), version 21.0 (IBM Corp., Armonk, NY, USA). Medians with first and third quartiles were presented for descriptive analyses. Percentages (%) and frequency tables were presented for nominal and ordinal variables. The normality of numerical variables was examined using the Kolmogorov-Smirnov and Shapiro-Wilk tests. For numerical data that did not conform to a normal distribution, the Mann-Whitney U test was used for pairwise comparisons, and the Kruskal-Wallis test was used for comparisons involving more than two independent groups. The relationship between two numerical variables was examined using Spearman rank correlation analysis. Correlation coefficients were interpreted as follows: r = 0.05–0.30 as low correlation, r = 0.30–0.40 as low-to-moderate correlation, r = 0.40–0.60 as moderate correlation, r = 0.60–0.70 as good correlation, r = 0.70–0.75 as very good correlation, and r = 0.75–1.00 as excellent correlation. Statistical significance was set at p < 0.05 for all tests.
Effect sizes for the Kruskal-Wallis comparisons were reported as epsilon-squared. To assess the influence of potential confounders, a multivariable median (quantile) regression of serum Gal-3 levels by group was performed with adjustment for age and BMI; quantile regression was selected because Gal-3 was non-normally distributed even after logarithmic transformation. In this model, the healthy control group served as the reference category, and results are presented as β coefficients with 95% confidence intervals (CIs). As HbA1c and diabetes duration are structurally determined by group membership (controls being normoglycemic and non-diabetic by definition), these variables were not entered as independent covariates in the between-group model. A small number of Gal-3 values exceeded the upper limit of the assay’s validated range (2000 pg/mL); as the primary analyses were rank-based and robust to extreme values, these were retained, and a sensitivity analysis excluding them did not alter the conclusions. These analyses were conducted in Python (statsmodels version 0.14).
Because the sample size was determined by the available cohort rather than by an a priori calculation, a sensitivity analysis was performed instead of a post hoc observed-power calculation, which is considered uninformative. With a two-sided α of 0.05 and 80% power, the three-group comparison of serum Gal-3 was powered to detect a minimum effect size of Cohen’s f = 0.35 (η² = 0.11; medium-to-large), whereas the within-group PEDIS comparison (n = 36) and pairwise comparisons were powered only for large effects (f = 0.54 and d = 0.85, respectively).
Results
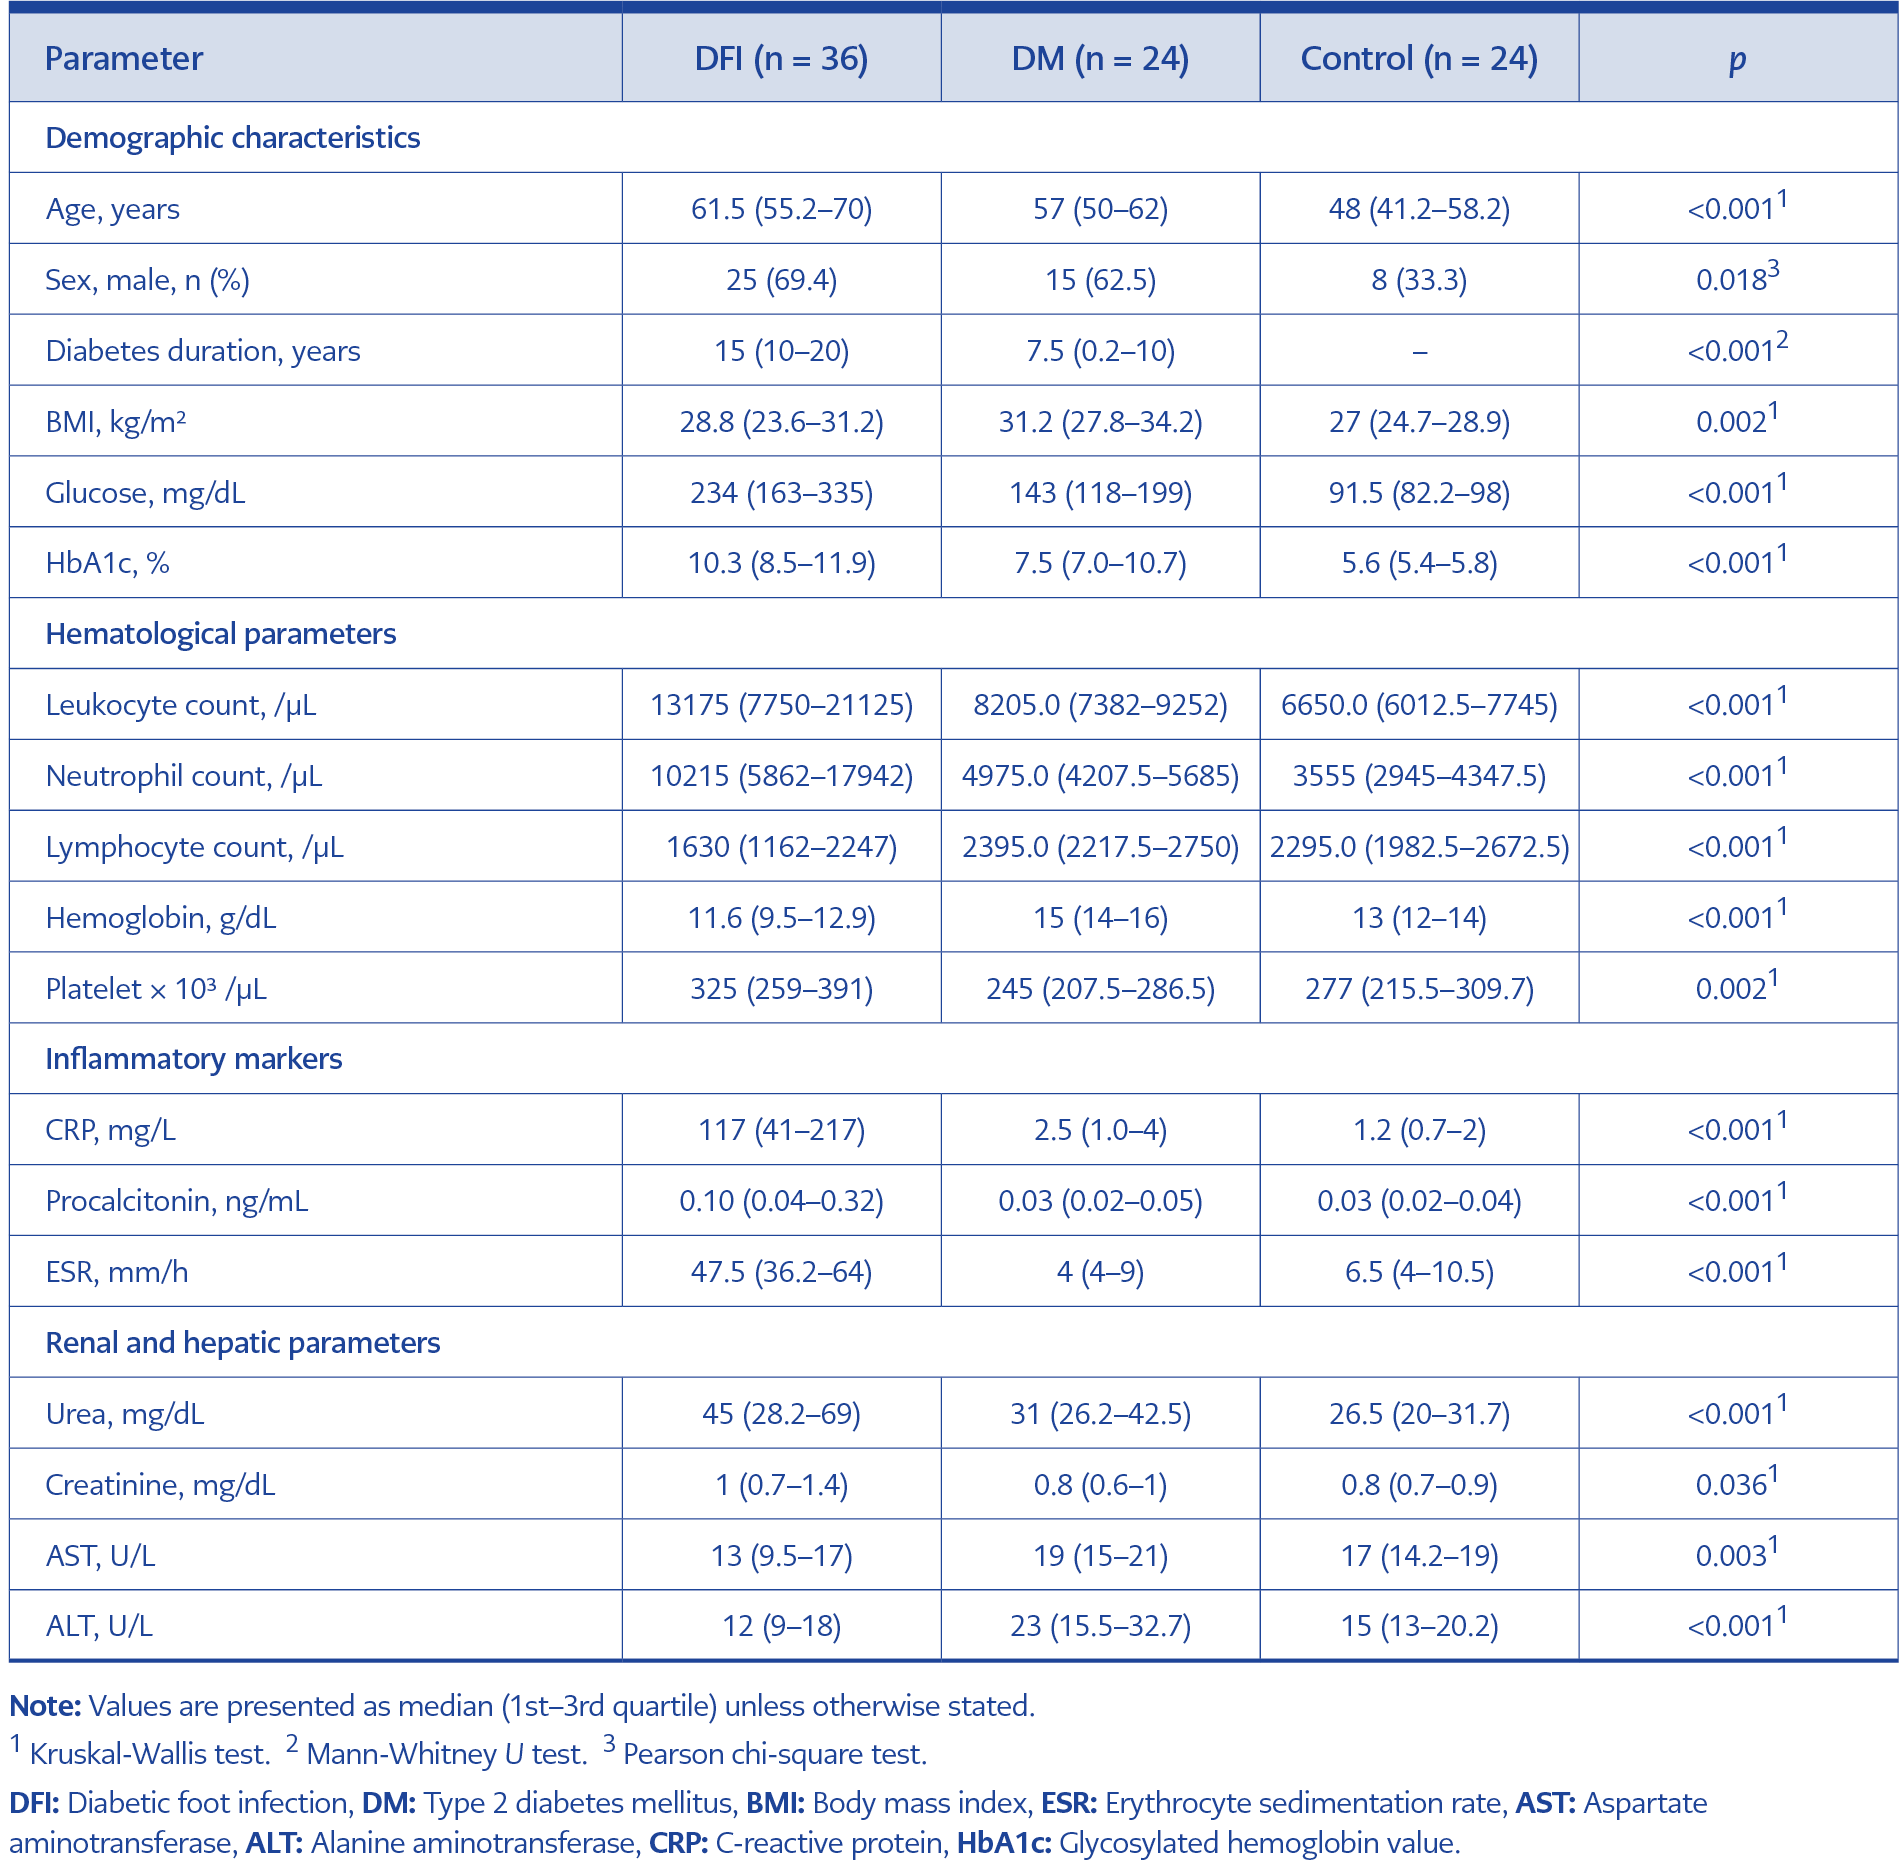
Table 1. Demographic characteristics and laboratory findings among patients with DFI, patients with type 2 DM, and healthy controls.
The study included 36 patients with DFI, 24 patients with type 2 DM, and 24 healthy controls. Of the 36 patients with DFI, 25 (69.4%) were male; of the 24 patients with type 2 DM, 15 (62.5%) were male; and of the 24 healthy controls, 16 (66.7%) were female. Demographic data and laboratory findings in the DFI, type 2 DM, and healthy control groups are presented in Table 1.
No growth was found in 9 (25%) of the wound cultures obtained from patients with DFI. Six (16.6%) patients had no suitable wound site for culture sampling or purulent discharge. Gram-positive microorganisms were isolated in 14 (38.8%) of the wound cultures, and Gram-negative microorganisms were isolated in 7 (19.4%). When individual microorganisms were evaluated, methicillin-susceptible Staphylococcus aureus (MSSA) was isolated in 16.6% of cultures, Proteus spp. in 8.2%, Streptococcus agalactiae in 5.6%, Klebsiella spp. in 5.6%, Enterococcus spp. in 5.6%, and Streptococcus pyogenes, Enterobacteriaceae spp., Staphylococcus haemolyticus, Streptococcus dysgalactiae and Enterobacteriaceae spp. plus Escherichia coli were each isolated in 2.8% of cultures.

Table 2. Gal-3 levels in the study groups.
Median Gal-3 levels in the DFI, type 2 DM, and healthy control groups were 232.54 pg/mL, 209.14 pg/mL, and 277.85 pg/mL, respectively, and no statistically significant differences were observed among the three groups (p > 0.05) (Table 2).
The effect size for the between-group comparison of serum Gal-3 was small (epsilon-squared = 0.056), consistent with the absence of a statistically significant difference. In multivariable median (quantile) regression adjusting for age and BMI, with the healthy control group as the reference category, neither the type 2 DM group (β = -39.4, 95% CI, -135.6 to 56.9; p = 0.42) nor the DFI group (β = -22.3, 95% CI, -112.6 to 68.1; p = 0.63) differed significantly from controls. Neither age (β = -1.18; 95% CI, -4.33 to 1.96; p = 0.46) nor BMI (β = -0.88; 95% CI, -8.21 to 6.45; p = 0.81) was independently associated with serum Gal-3 in the adjusted model. In exploratory Spearman analyses, serum Gal-3 was not significantly associated with patient-related factors: the correlation with age was weak and negative across the sample (ρ = -0.23, p = 0.039), whereas correlations with BMI (ρ = -0.16, p = 0.15) and HbA1c (ρ = -0.21, p = 0.07) were not significant. Within the DFI group, Gal-3 showed no association with age (ρ = -0.05) or BMI (ρ = 0.03).
When patients with DFI were classified according to PEDIS grade, 16 (44.4%) were classified as PEDIS grade 4, 11 (30.6%) as PEDIS grade 3, and 9 (25%) as PEDIS grade 2.

Table 3. Gal-3 levels in patients with DFI according to PEDIS grade.
When Gal-3 levels were compared across PEDIS grades in patients with DFI, no statistically significant difference was found (p > 0.05) (Table 3).

Table 4. Correlation of Gal-3 levels with CRP, procalcitonin, leukocyte count, and ESR.
When the associations of Gal-3 levels with CRP, procalcitonin, leukocyte count, and ESR were examined, no statistically significant correlations were found (p > 0.05) (Table 4).
Discussion
In this case-control study, serum Gal-3 levels did not differ significantly among patients with DFI, patients with type 2 diabetes, and healthy controls, nor did they vary across PEDIS grades. Furthermore, Gal-3 showed no significant associations with established inflammatory markers (CRP, procalcitonin, ESR, and leukocyte count). These findings suggest that, in our cohort, serum Gal-3 had limited utility as a diagnostic or severity-assessment biomarker in DFI—a result that contrasts with several previous reports and warrants careful biological interpretation, as discussed below.
Several factors may explain the absence of a significant association between serum Gal-3 and DFI in our cohort. First, Gal-3 is primarily a marker of sustained, low-grade chronic inflammation and tissue fibrosis rather than of acute bacterial infection; the acute neutrophil-driven inflammatory response that dominates DFI may be better captured by conventional acute-phase markers, such as CRP and procalcitonin, consistent with the lack of correlation we observed between Gal-3 and these markers. Second, DFI is pathophysiologically heterogeneous, encompassing variable contributions of peripheral arterial disease, neuropathy, soft-tissue infection, and osteomyelitis, which may dilute any uniform Gal-3 signal. In addition to these biological considerations, methodological factors—including the working range of the research-use assay and the study’s limited statistical power—may have contributed, and these are addressed in the Limitations section. Taken together, our negative findings likely reflect both biological factors and methodological constraints, rather than a definitive absence of any association.
Notably, although the control group was younger and Gal-3 has been reported to increase with age, in our sample Gal-3 correlated weakly and negatively with age, and the youngest group (controls) showed the highest median levels. This pattern does not support age as a confounder that masked a true elevation in the patient groups, and the absence of a group effect persisted after adjustment for age and BMI (median regression: DM β = -39.4, p = 0.42; DFI β = -22.3, p = 0.63).
Previous studies investigating the relationship between Gal-3 and diabetes have reported inconsistent results. Weigert et al. (13) demonstrated significantly higher serum Gal-3 levels in patients with type 2 diabetes and obesity, while also reporting an inverse relationship between Gal-3 and glycosylated hemoglobin levels. Similarly, a 2019 study found no difference in Gal-3 levels between prediabetic individuals and healthy controls, whereas Gal-3 levels were significantly higher in patients with type 2 diabetes (14). Kumar et al. (15) reported higher Gal-3 levels in patients with elevated HbA1c levels, and other studies comparing diabetic, prediabetic, and healthy groups observed a stepwise increase in Gal-3 levels from healthy individuals to individuals with prediabetes and diabetes (16). In contrast, some studies have suggested a potential protective role of Gal-3. A cross-sectional study reported that lower Gal-3 levels in diabetic patients were associated with insulin resistance and hyperinsulinemia (17). However, another cross-sectional study involving newly diagnosed type 2 diabetes patients reported higher Gal-3 levels compared with healthy controls, supporting an association between elevated Gal-3 and diabetes (18). In our study, median Gal-3 levels did not differ significantly among healthy controls, patients with diabetes, and those with DFI. If anything, the diabetes group showed numerically lower (rather than higher) Gal-3 levels than controls, a direction more consistent with reports linking diabetes to reduced Gal-3 (17) than with those describing its elevation. Overall, the relationship between Gal-3 and diabetes remains unclear. While some studies suggest a pathogenic role, others propose potentially protective effects, highlighting the complexity of Gal-3 biology and the need for further investigation.
A study by Gunes et al. (19) reported significantly higher Gal-3 levels in patients with diabetic foot ulcers compared with both diabetic patients without foot ulcers (p = 0.001) and healthy controls
(p < 0.001) and demonstrated a positive correlation between Gal-3 levels and routinely used acute-phase markers, including CRP and ESR. Similarly, a study conducted in China evaluating the relationship between Gal-3 levels and vascular disease found that elevated Gal-3 levels in patients with type 2 diabetes were associated with an increased risk of peripheral vascular disease and were positively correlated with CRP levels (20). In contrast to these findings, our study found no significant differences in Gal-3 levels among patients with DFI, those with diabetes, and healthy controls. Moreover, no correlations were observed between Gal-3 levels and inflammatory markers, including CRP, procalcitonin, ESR, and leukocyte count. Although no previous studies have specifically evaluated the association between Gal-3 levels and PEDIS grades in patients with DFI, our analysis also revealed no significant difference in Gal-3 levels across PEDIS grades.
Beyond the primary findings, the baseline characteristics of our cohort, including the predominance of male patients, higher BMI, and longer diabetes duration in the DFI group, were broadly consistent with previous reports on the epidemiology of DFI (15,19,21,22) and are presented as descriptive findings rather than principal outcomes of this study. Because these variables differed between groups, residual confounding cannot be excluded despite adjustment for age and BMI, and this issue is discussed in the limitations section.
This study has several limitations. The control group was younger than the diabetes and DFI groups; however, as noted above, Gal-3 did not increase with age in our sample, and the group difference remained non-significant after adjustment, which does not suggest meaningful age-related confounding. The sample size, although sufficient to detect a moderate-to-large between-group effect (sensitivity analysis: detectable Cohen’s f = 0.35 at α = 0.05 and 80% power), was underpowered for small-to-moderate effects, which therefore cannot be excluded. Serum Gal-3 was measured with a research-use sandwich ELISA whose validated working range (5–2000 pg/mL) is lower than the physiological serum concentrations reported with reference clinical assays; although all samples were processed identically, ensuring internal comparability, this may limit direct comparison with other studies and may have reduced the assay’s discriminatory capacity, and a few values fell above the assay’s upper range. The absence of chronic disease in the control group was established by participant self-report rather than systematic screening, potentially allowing undetected subclinical conditions, and smoking status, which has been associated with circulating Gal-3 levels, was not recorded for any participant. In addition, hypertension, which is highly prevalent in this age group and difficult to avoid when recruiting patients with diabetes, was not applied as an exclusion criterion in the DM and DFI groups; as hypertension has been associated with Gal-3, it represents a further potential unmeasured confounder. Finally, the single-center design may limit the generalizability of the findings. Accordingly, the results should be interpreted with caution, and larger, multicenter, age-matched studies are warranted to clarify the role of Gal-3 in DFI.
In conclusion, this study evaluated Gal-3 levels among patients with DFI across different PEDIS grades. No statistically significant differences were observed in Gal-3 levels among patients with DFI, patients with type 2 diabetes, and healthy controls, nor was Gal-3 associated with DFI severity. These findings contrast with some previous studies on diabetes and its complications but suggest that Gal-3 may have limited utility as a biomarker for the diagnosis or severity assessment of DFI. Given the limited number of studies in this field and the heterogeneity of existing results, further well-designed, multicenter studies with larger and adequately powered cohorts are required to clarify the role of Gal-3 in DFI.