Introduction
Severe acute respiratory syndrome coronavirus 2 (SARS-CoV-2), the virus responsible for COVID-19, has had a profound global impact, infecting approximately 800 million people and causing more than 7 million deaths (1). In infected individuals, the immune system plays a central role in controlling the disease. One key component of this response is the production of SARS-CoV-2-specific antibodies (2). These antibodies bind to viral structures, neutralize the virus, and prevent replication, thereby reducing the risk of continued infection (3). However, the magnitude of this antibody response varies widely among individuals; some develop minimal antibody levels, while others exhibit elevated antibody titers. Although the basis of this variability remains unclear, it raises important questions about whether the strength of the antiviral antibody response may influence other immunological processes, including autoantibody formation.
Autoantibody development has emerged as a notable immunologic feature of SARS-CoV-2 infection, with potential implications for disease pathogenesis and long-term outcomes. These autoantibodies target self-antigens and have been associated with tissue injury, thrombosis, neurological and cardiac complications, impaired immune responses, and interstitial lung disease (4-6). Among them, antinuclear antibodies (ANAs) are the most frequently observed subtype (7). Antinuclear antibodies are thought to enter cells and target structures such as the nucleus, DNA, RNA, and centromeres, potentially disrupting cellular function, activating inflammatory pathways, and causing tissue damage.
Common ANA subtypes include anti–double-stranded DNA (anti-dsDNA), directed against genetic material, and anti–extractable nuclear antigens (anti-ENA), which target intracellular components. Although these antibodies are typically detected by enzyme-linked immunosorbent assay (ELISA), assays using HEp-2 cell nuclei, which are rich in ANA antigens, are increasingly common in diagnostic practice (8).
Several immunologic mechanisms may contribute to the development of ANA following SARS-CoV-2 infection. Bystander activation can occur during the intense cytokine response triggered by the virus, potentially activating autoreactive lymphocytes that would otherwise remain quiescent (9) Epitope spreading, associated with infection-induced tissue injury, may allow an immune response initially directed at viral antigens to expand to nuclear antigens over time (10). Excessive neutrophil activation during COVID-19 may also promote NETosis, releasing DNA and histones that the immune system may recognize as foreign, thereby driving ANA production (11). Molecular mimicry has likewise been proposed, as similarities between SARS-CoV-2 spike protein epitopes and antigens expressed in tissues such as the thyroid, pituitary, adrenal cortex, and pancreatic beta cells may permit cross-reactivity with self-antigens (12,13). Collectively, these mechanisms provide a biologically plausible pathway for ANA development during SARS-CoV-2 infection.
The mechanisms underlying extremely high levels of SARS-CoV-2 antibody production remain unclear, yet such responses may reflect processes beyond a typical immune reaction. In this context, the release of autoantigens, exposure of nuclear material, or cross-reactivity may become more prominent, contributing to ANA formation. This study aimed to investigate the relationship between varying levels of SARS-CoV-2-specific antibodies and ANA production, with particular attention to individuals exhibiting the uncommon condition of exceptionally high antibody titers.
Materials and Methods
This retrospective study used archived serum samples collected from individuals aged 18 to 60 years during the COVID-19 pandemic (2020–2022). Ethical approval was obtained from the İnönü University Health Sciences Non-Invasive Clinical Research Ethics Committee (approval number: 2022/3802). Samples from individuals with chronic diseases or a known history of autoimmune disorders were excluded.
Measurement of Anti-SARS-CoV-2 IgG Antibody Levels
Anti-SARS-CoV-2 IgG levels were measured using a quantitative commercial ELISA kit (QuantiCOR, Y Immunotek Inc., Malatya, Türkiye) (14). The assay is based on purified whole-virus lysate, providing broad antigenic coverage, and was evaluated and approved by the Microbiology Reference Laboratory of the General Directorate of Public Health, Ministry of Health of Türkiye (product release no: 8683190715019; reference no: SER21-001; application date: July 30, 2021).
According to the manufacturer’s validation data, the assay demonstrates 100% specificity and ~95% sensitivity. The dynamic range is 1–450 RU/mL. Anti–SARS-CoV-2 IgG levels ≥10 RU/mL were considered positive, and levels <10 RU/mL were considered negative.
Criterion for High Anti–SARS-CoV-2 IgG Positivity
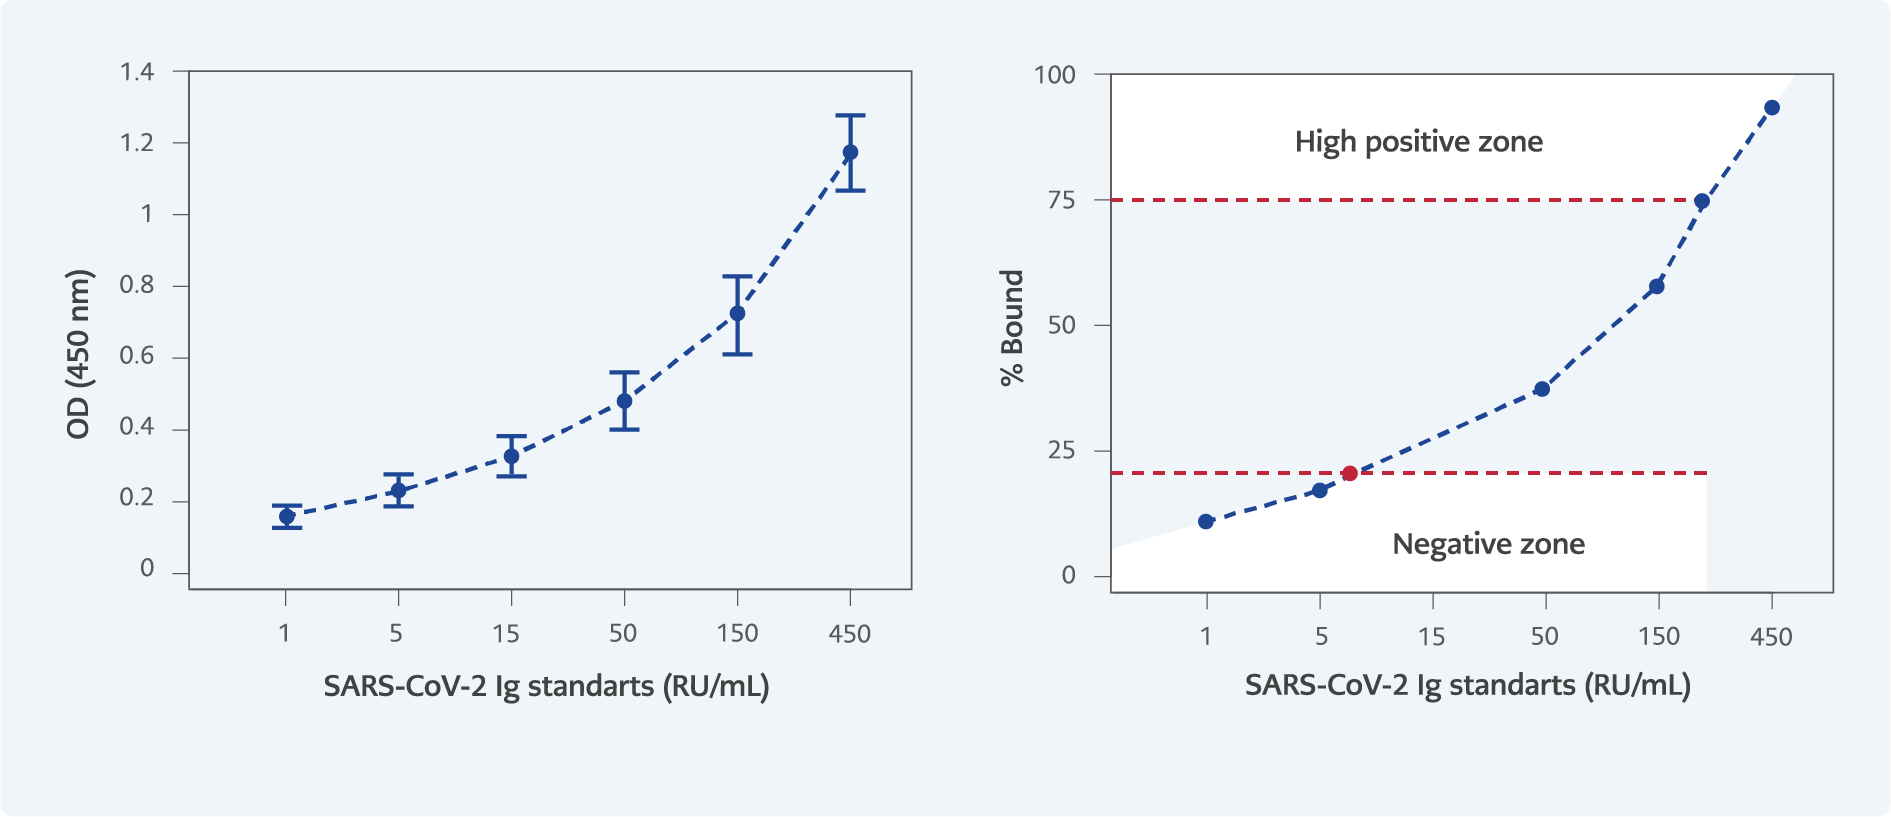
Figure 1. % Bound – SARS-CoV-2 IgG Standards Curve. According to the graph, a value of 235 RU/mL was determined to correspond to a 75% binding level. Antibody levels exceeding 235 RU/mL were classified as high positive, those ranging from 10 to 234 RU/mL as moderate positive, and levels below 10 RU/mL as negative.
The criterion for high positivity was based on the percentage binding value (% Bo/B) in the standard curve, calculated as (optical density [OD]/Standard 1) × 100. Samples with binding >75% Bo/B (>235 RU/mL) were classified as highly positive; values between 10 and 235 RU/mL were classified as positive; and values <10 RU/mL were classified as negative (Figure 1).
Study Design
Plasma samples collected during the COVID-19 pandemic were initially screened for anti-SARS-CoV-2 IgG antibodies. Individuals with chronic diseases—such as hypertension, diabetes mellitus, ankylosing spondylitis, cardiovascular diseases, cancer, hypothyroidism, asthma, allergy, glaucoma, psoriasis, Sjögren’s syndrome, Behçet’s disease, chronic obstructive pulmonary disease (COPD), peptic ulcer disease, and Hashimoto’s thyroiditis—were excluded from the study. The study population consisted of individuals who were either asymptomatic or had mild to moderate COVID-19; no participants with severe disease requiring hospitalization or intensive care unit (ICU) admission were included.
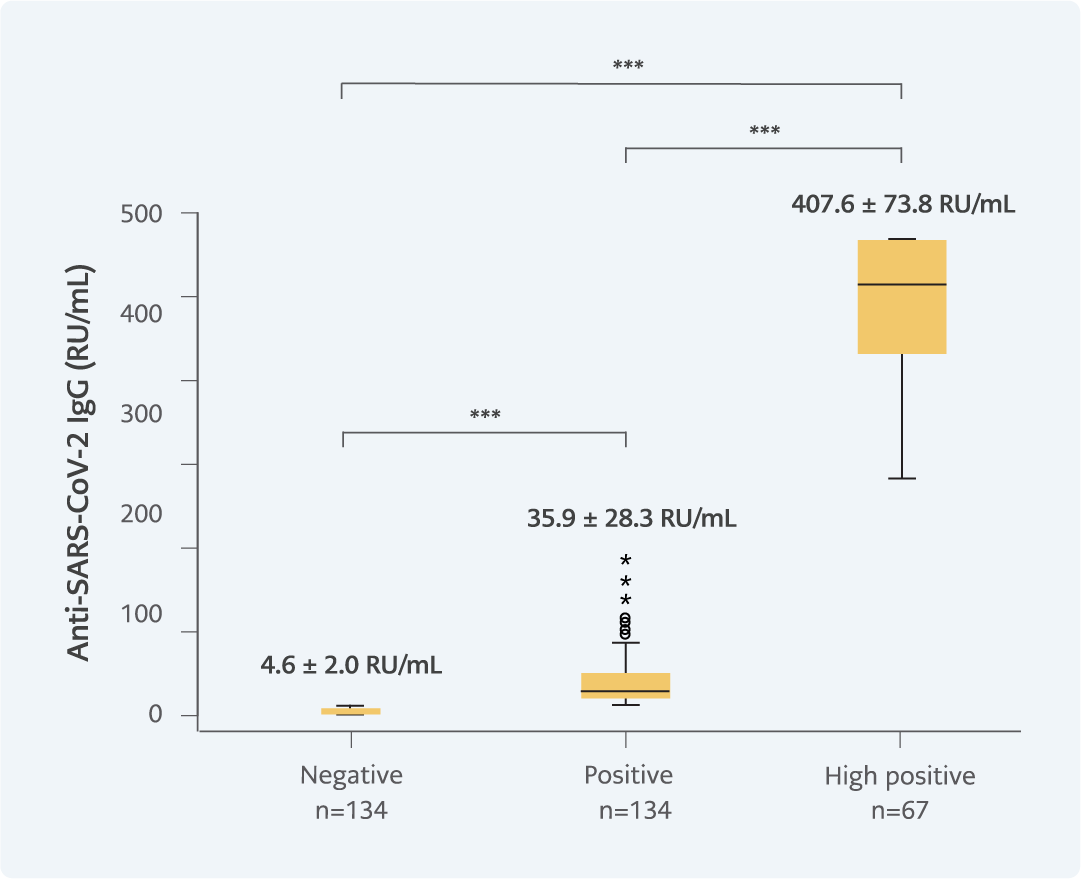
Figure 2. SARS-CoV-2 IgG levels of the experimental groups (p=0.000). All three groups differed in terms of their anti-SARS-CoV-2 IgG antibody level.
***p<0.001
After exclusion, the remaining samples were categorized into three groups based on their anti-SARS-CoV-2 IgG levels: negative (<10 RU/mL), positive (>10 RU/mL), and high-positive (>235 RU/mL, >75% Bo/B in the calibration curve; Figure 2).
For ANA analyses, the number of samples in the negative and positive groups was predetermined to be twice the number of samples in the high-positive group. Samples were selected using the Excel RANDOM function to achieve the planned group sizes. Group distribution by sex was recorded.
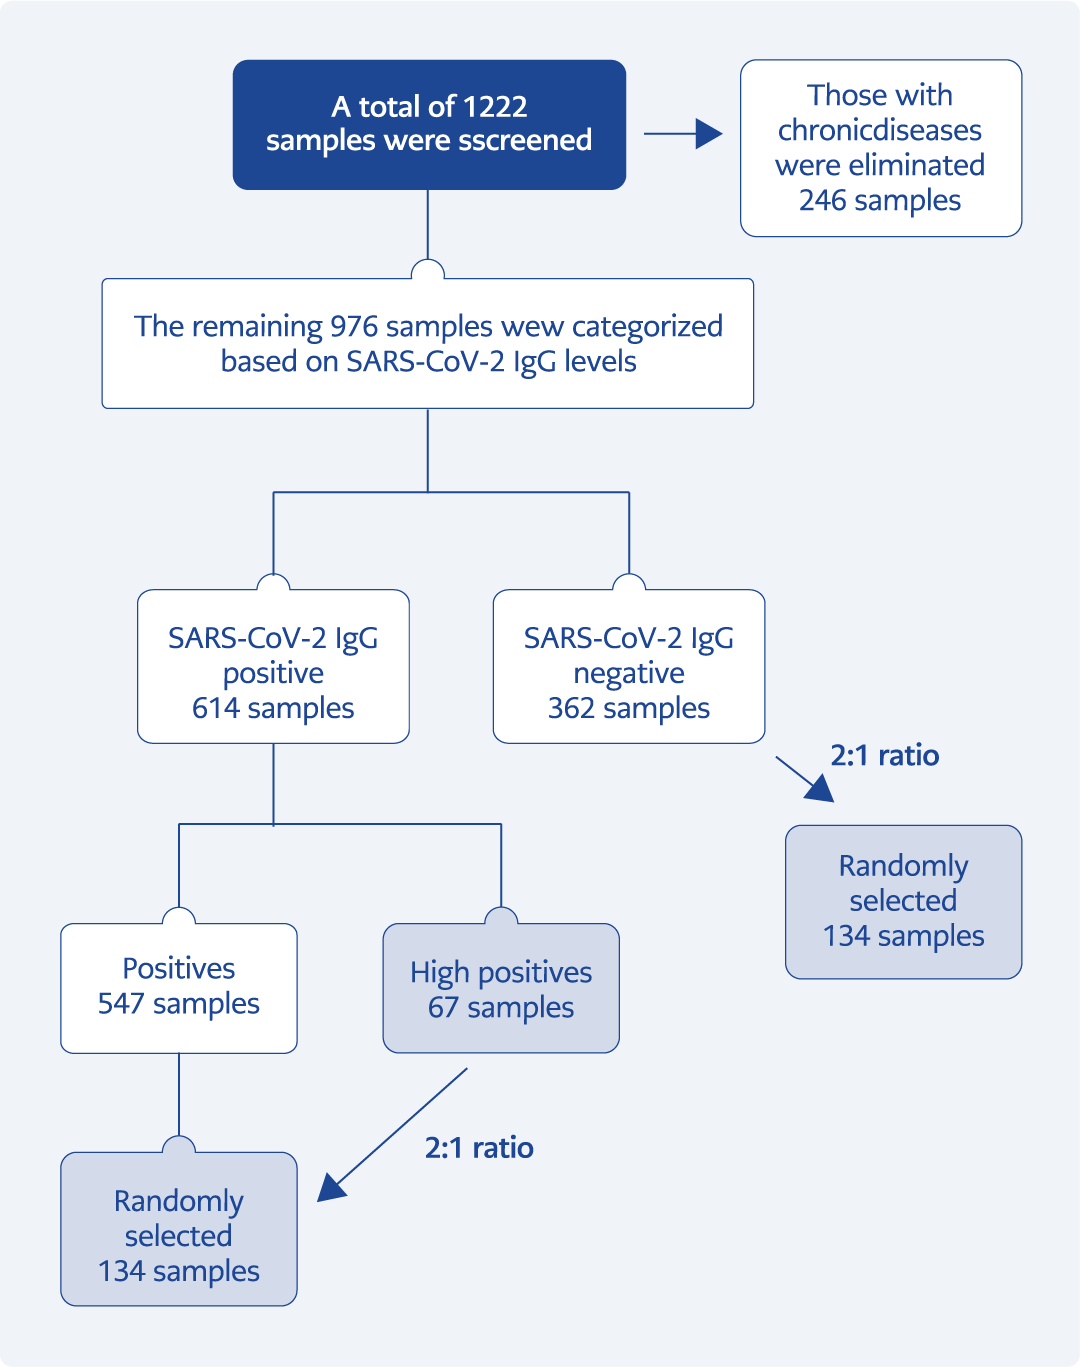
Figure 3. Formation of experimental groups (see text for explanation).
The overall workflow of sample screening, exclusion, and group allocation is presented in Figure 3.
Determination of ANA Positivity in Study Groups
- Antinuclear antibody levels were determined using three validated commercial ELISA kits targeting the following autoantibodies:
- Anti-dsDNA
- Anti-ENA — based on calf thymus extract containing La/SSB, Sm, nRNP, and Jo-1 antigens
- Anti–HEp-2 nucleus antibodies (15)
All procedures were performed according to the manufacturer’s protocols. Serum samples were diluted 1:100 and added to the assay wells together with negative and positive controls. Subsequently, anti-human IgG conjugated with biotin and streptavidin-peroxidase was applied. Plates were washed three times with 0.05% Tween before each solution was added. Finally, a chromogenic substrate (tetramethylbenzidine, TMB) was added, and the reaction was stopped with 11% H2SO4. Absorbance values were measured at 450 nm using a spectrophotometer.
Calculation of Results
The cut-off value was determined using the following formula:
Cut-off value = negative control OD × 1.5
Optical density measurements were converted to an antibody index using the following formula:
Antibody index = sample OD / cut-off OD
Interpretation criteria were as follows:
- Index <1.0: ANA IgG negative,
- Index >1.0: ANA IgG positive.
The assay run was considered valid when the positive control had an index >1.1 and the negative control had an index <0.9.
Validation and Performance of the Test Kits
Intra-assay and inter-assay coefficients of variation (CV) were determined by repeated measurements of known positive and negative samples across four test plates. The mean CV values were 7.8% for dsDNA assay, 7.5% for ENA assay, and 9.9% for the Hep-2 nucleus assay (15).
Sensitivity and specificity were evaluated using reference samples (n=48 for dsDNA; n=24 for ENA; n=24 for Hep-2). The sensitivity and specificity were 93.8% and 91.7% for dsDNA, 83.3% for both parameters in the ENA assay, and 90% and 87.5% for the Hep-2 nucleus assay, respectively (15).
Cross-reactivity was evaluated using sera positive for other autoantibodies, including anti–cyclic citrullinated peptide (anti-CCP), anti–β2-glycoprotein I (anti-β2GPI), anti–myeloperoxidase (anti-MPO), anti–proteinase 3 (anti-PR3), and anti-cardiolipin antibodies, with no interference observed in the dsDNA and Hep-2 assays (15).
These ELISA kits are intended exclusively for research purposes and are not subject to formal regulatory approval by agencies such as the Turkish Medicines and Medical Devices Agency (TİTCK), U.S. Food and Drug Administration (FDA), or the European Medicines Agency (EMA). Validation was performed by comparison with well-established commercial ELISA kits that are “Conformité Européenne” (CE)-marked or listed as in vitro diagnostic (IVD) products by the FDA, including Chorus ds-DNA-G (DIESSE Diagnostica Senese S.p.A.) and ANA-8-Screen (DRG).
Statistical Analysis of Data
Normality of the data was tested using the Kolmogorov-Smirnov test, which indicated that the data did not follow a normal distribution. Therefore, nonparametric tests were used. The Kruskal-Wallis test was used to compare the three independent groups (negative, positive, high-positive), and post-hoc analyses were performed with Bonferroni-corrected Mann-Whitney U tests. Correlations were assessed using Spearman’s rank test.
Results
A total of 1222 serum samples were initially screened for anti-SARS-CoV-2 IgG antibodies. After excluding 246 individuals with chronic diseases, 976 samples remained eligible. Based on anti-SARS-CoV-2 IgG levels, these samples were categorized as negative (n=362), positive (n=547), and high positive (n=67).
For ANA analyses, the number of samples in the negative and positive groups was standardized to twice the number of high-positive samples through random selection. The final sample sizes were 67 for the high-positive group, 134 for the negative group, and 134 for the positive group.
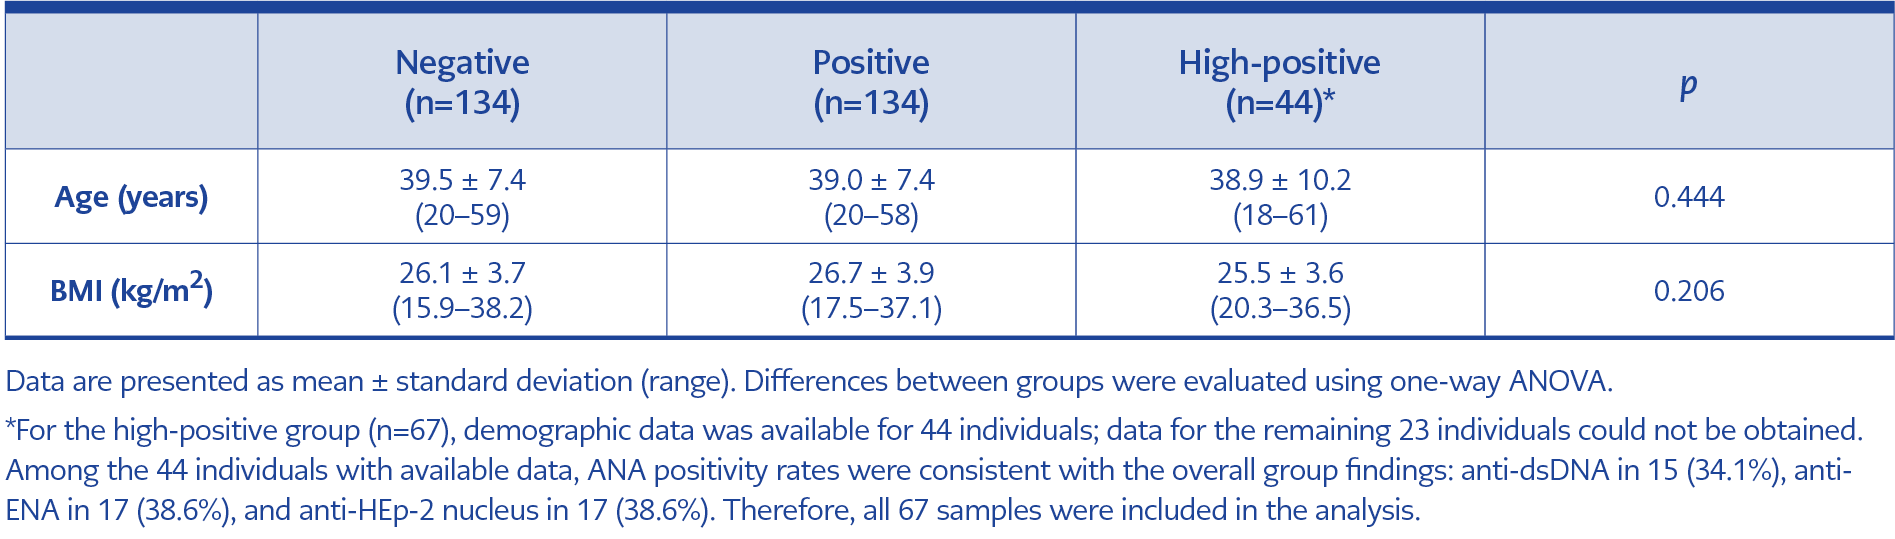
Table 1. Demographic characteristics of study participants by antibody positivity status.
The demographic characteristics of these groups are presented in Table 1. No statistically significant differences were observed between the groups in age or body mass index (BMI). The mean age was 39.5 ± 7.4 years (range, 20–59) in the negative group, 39.0 ± 7.4 years (range, 20–58) in the positive group, and 38.9 ± 10.2 years (range, 18–61) in the high positive group (p=0.444). Mean BMI values were 26.1 ± 3.7 (range, 15.9–38.2) in the negative group, 26.7 ± 3.9 (range, 17.5–37.1) in the positive group, and 25.5 ± 3.6 kg/m² (range, 20.3–36.5) in the high positive group (p=0.206), indicating demographically comparability across groups.
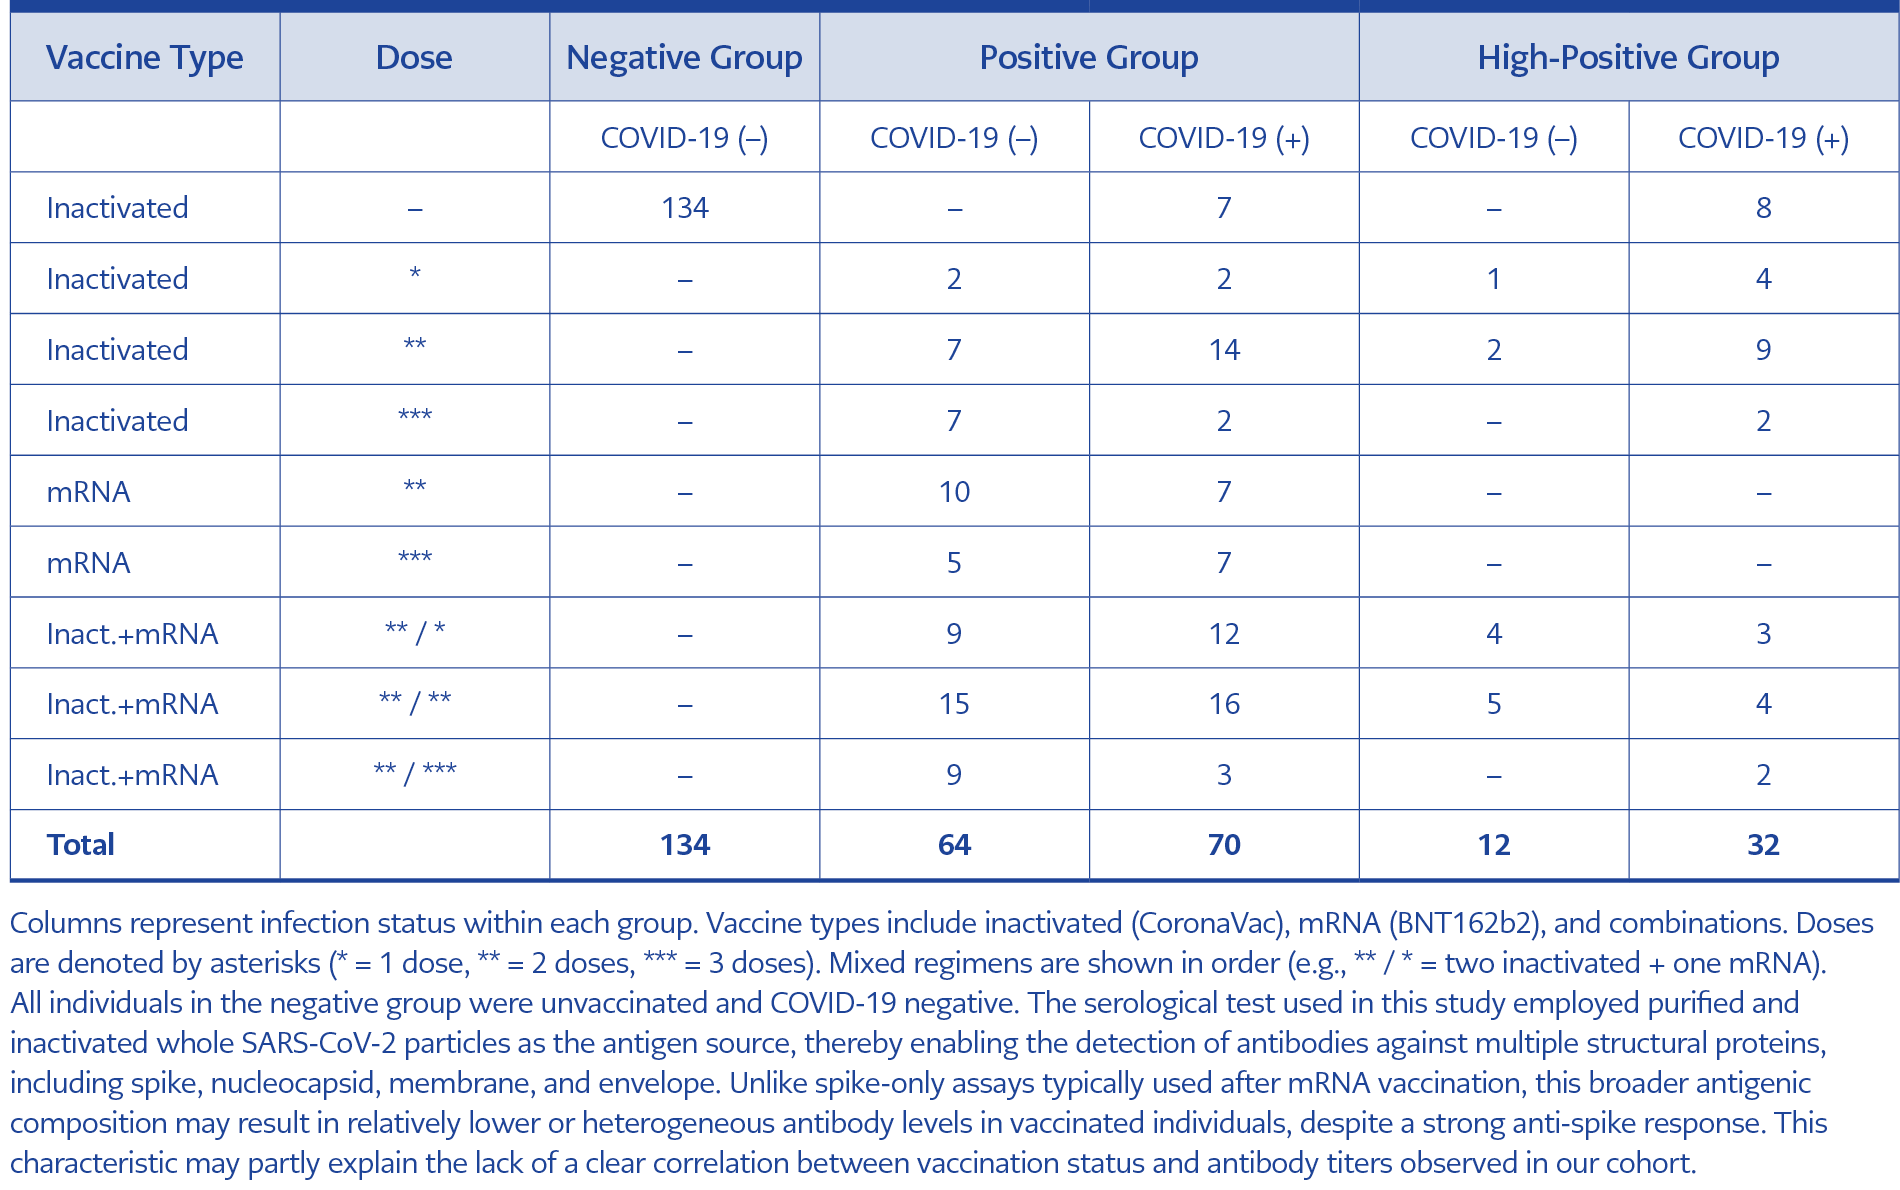
Table 2. Distribution of vaccine type, dose, and COVID-19 infection status across study groups. Participants are categorized into negative, positive, and high-positive groups based on ANA reactivity.
The distribution of vaccine types and COVID-19 infection status across study groups is summarized in Table 2. All individuals in the negative group (n=134) were unvaccinated and had no history of COVID-19 infection. In contrast, participants in the positive and high-positive groups had a history of COVID-19 vaccination, prior infection, or both. Vaccination and infection patterns were generally similar between these two groups. While some individuals had received only an inactivated SARS-CoV-2 vaccine (CoronaVac; Sinovac Biotech Ltd., China), others had received only an mRNA-based SARS-CoV-2 vaccine (BNT162b2; Pfizer-BioNTech, USA-Germany), and some had received both types of vaccines in a mixed regimen.
In the positive group, 64 individuals were COVID-19 negative and 70 were COVID-19 positive, with autoantibody positivity rates showing no significant differences between these subgroups. Anti-dsDNA antibodies were detected in 3 out of 64 (4.7%) of the COVID-19 negative and 7 out of 70 (10.0%) of the COVID-19 positive individuals (p=0.330). Anti-ENA antibodies were present in 5 out of 64 (7.8%) and 6 out of 70 (8.6%) (p=1.000), while anti-HEp-2 antibodies were detected in 3 out of 64 (4.7%) and 4 out of 70 (5.7%), respectively (p=1.000).
Among participants in the high-positive group, 32 had a history of COVID-19 infection, and 12 did not. Autoantibody positivity rates were similar between these groups. Anti-dsDNA antibodies were detected in 6 out of 12 (50.0%) of COVID-19 negative and 9 out of 32 (28.1%) of COVID-19 positive individuals (p=0.284). Anti-ENA positivity rates were 7 out of 12 (58.3%) of COVID-19 negative and 10 out of 32 (31.3%) (p=0.164) of COVID-19 positive individuals, while anti-HEp-2 antibodies were detected in 6 out of 12 (50.0%) of COVID-19 negative and 11 out of 32 (34.4%) of COVID-19 positive individuals (p=0.489).
Vaccination distributions in the positive and high-positive groups were comparable. The potential effects of COVID-19 vaccination status on ANA development were not the primary focus of this study and have been evaluated separately in an independent analysis, the results of which have been published elsewhere (16).
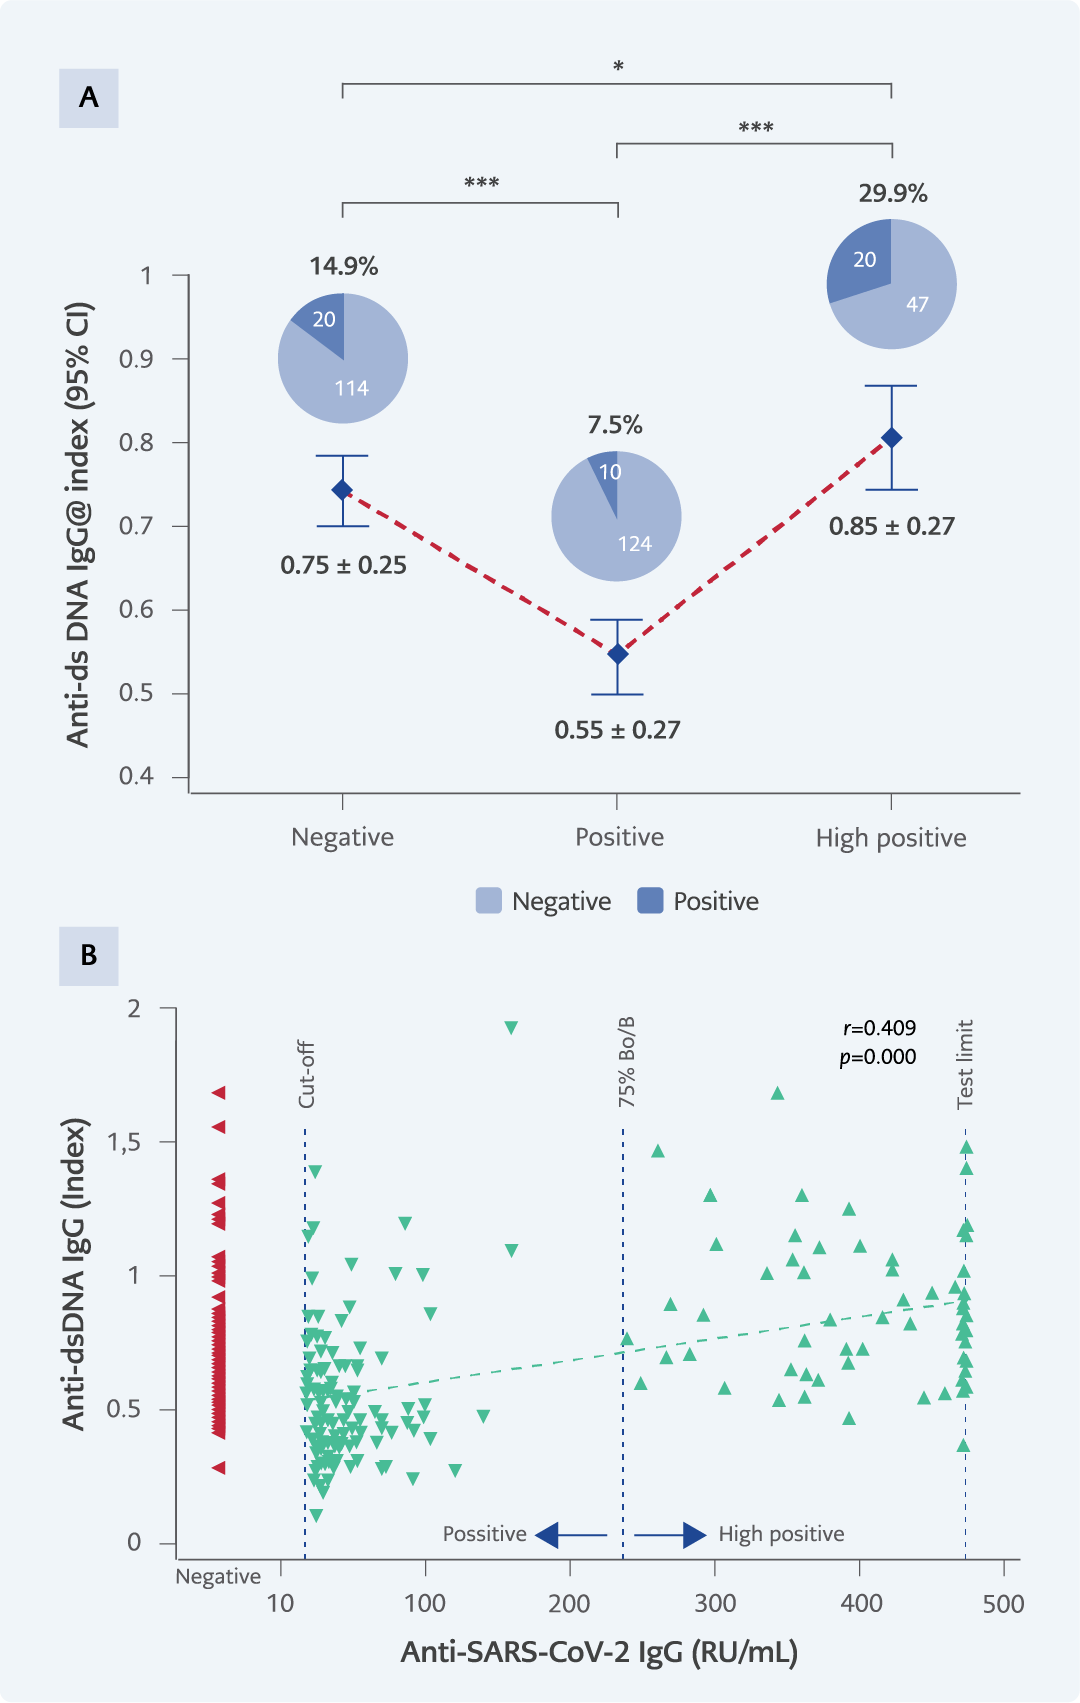
Figure 4. A) Anti-dsDNA IgG levels and positivity percentages across experimental groups: dsDNA positivity by gender: negative group (14 females, 6 males), positive group (6 females, 4 males), high positive group (12 females, 8 males). B) The correlation between SARS-CoV-2 IgG and anti-dsDNA levels.
*p<0.05; **p<0.001; ***p<0.0001.
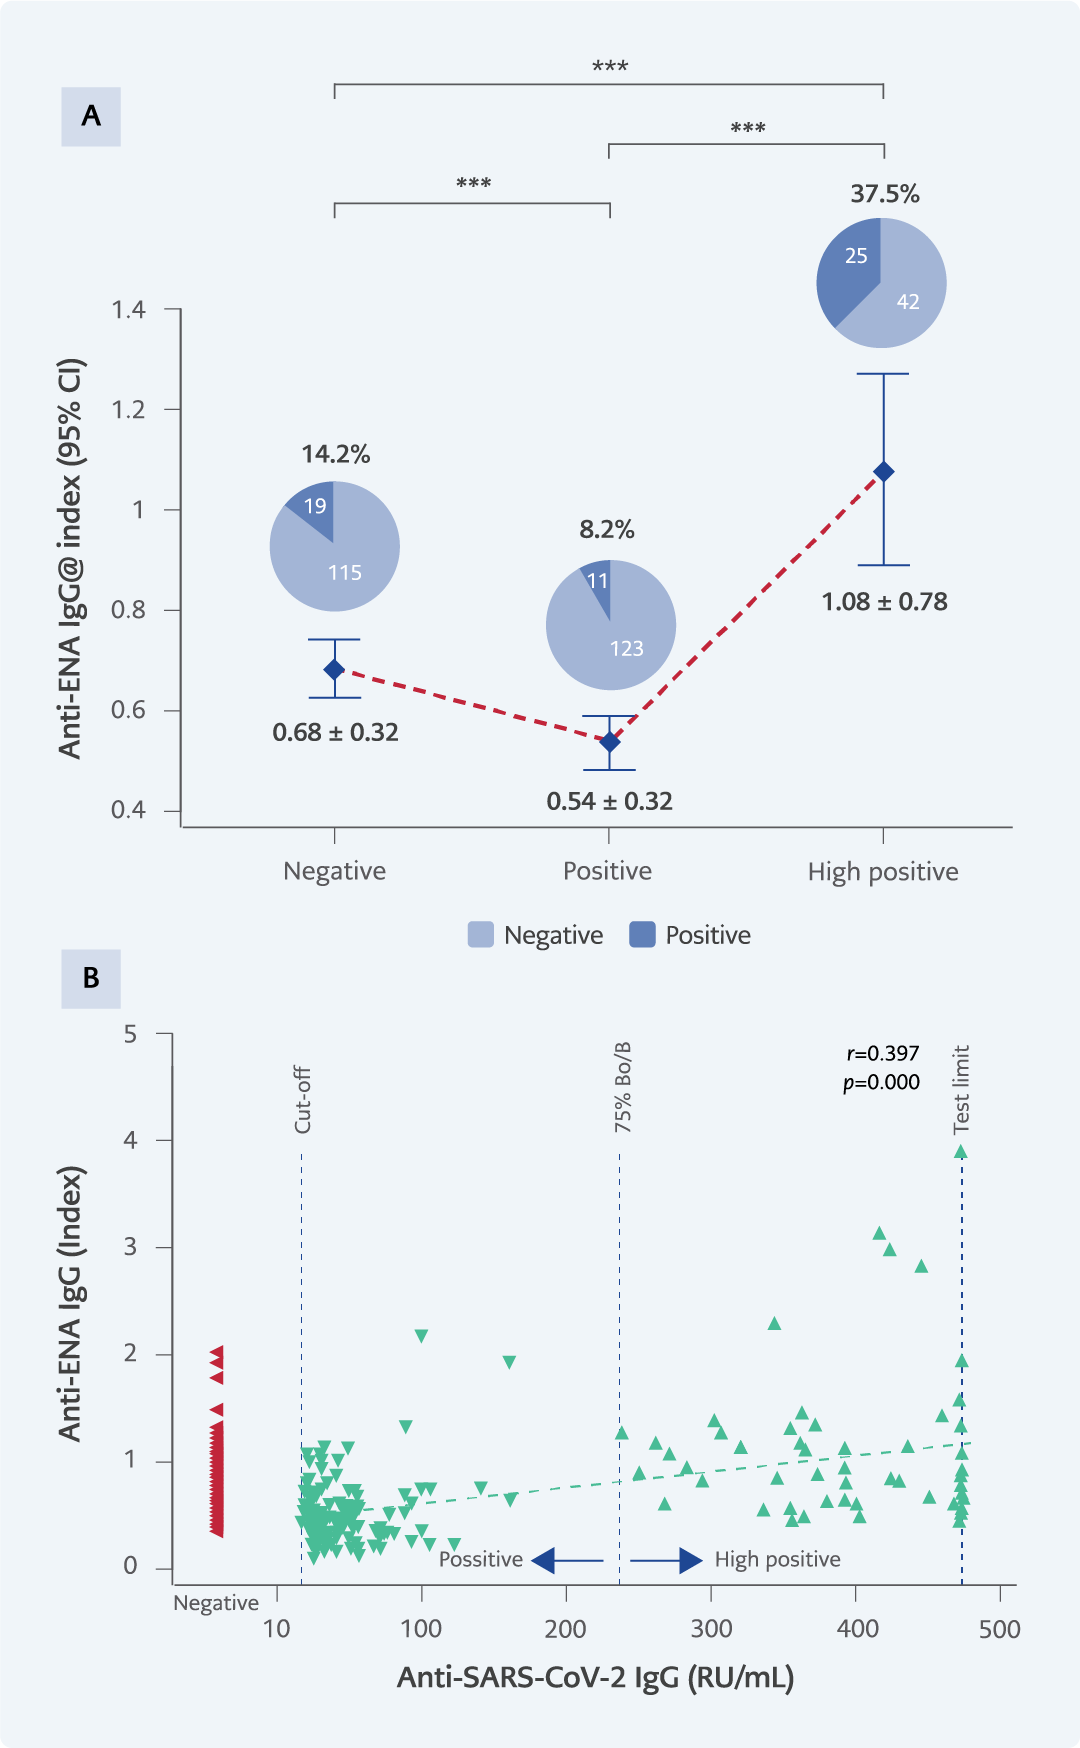
Figure 5. A) Anti-ENA IgG levels and positivity percentages across experimental groups. ENA positivity by gender: negative group (13 females, 6 males), positive group (7 females, 4 males), high positive group (13 females, 12 males). B) The correlation between SARS-CoV-2 IgG and anti-ENA levels.
*p<0.05; **p<0.001; ***p<0.0001.
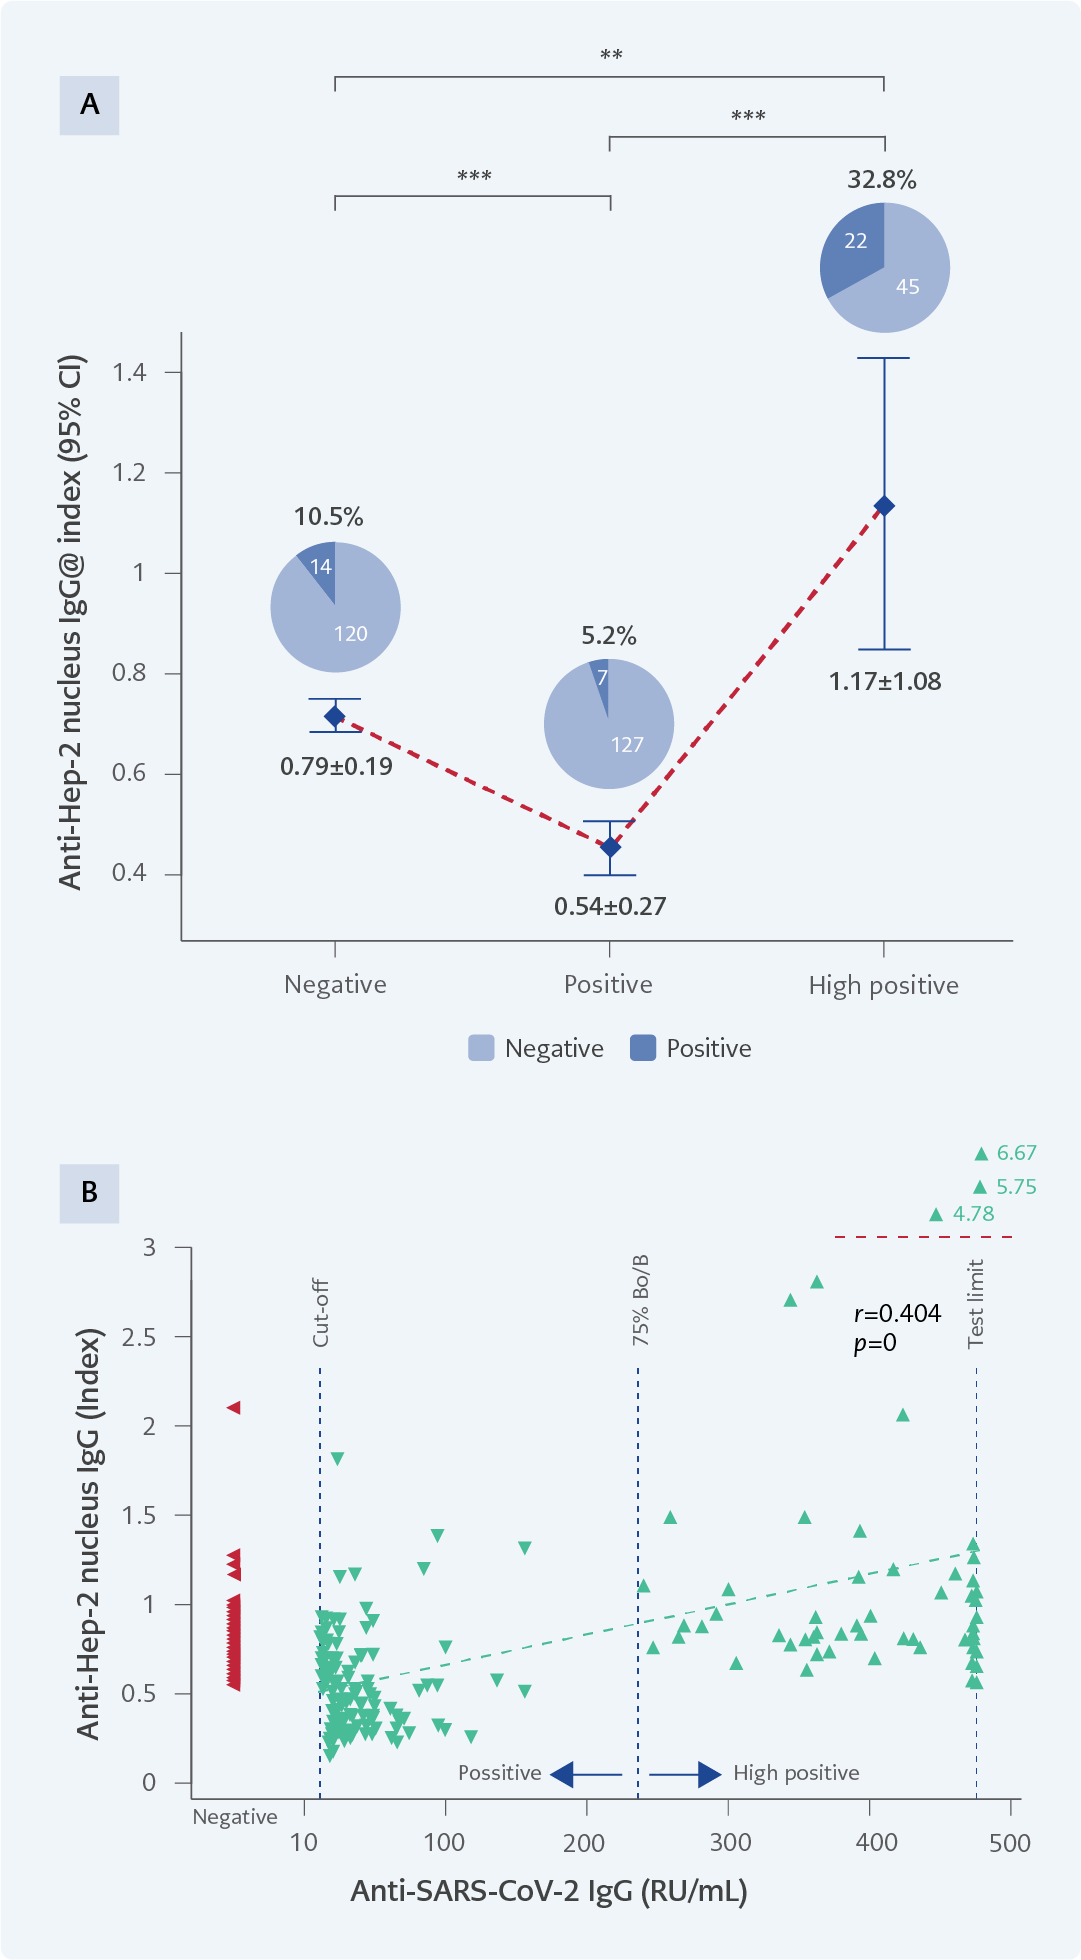
Figure 6. A) Anti-Hep-2 nucleus IgG levels and positivity percentages across experimental groups. Hep-2 nucleus positivity by gender: negative group (9 females, 5 males), positive group (5 females, 2 males), high positive group (15 females, 7 males). B) The correlation between SARS-CoV-2 IgG and anti-Hep-2 nucleus levels.
*p<0.05; **p<0.001; ***p<0.0001.
Autoantibody positivity rates differed significantly across the three IgG groups. For anti-dsDNA, positivity was observed in 14.9% (20/134) of samples from the negative group, 7.5% (10/134) in the positive group, and 29.9% (20/67) in the high positive group (p=0.000) (Figure 4A). In the anti-ENA assay, positivity rates were 14.2% (19/134), 8.2% (11/134), and 37.3% (25/67), respectively (p=0.000) (Figure 5A). For anti-Hep-2 antibodies, positivity occurred in 10.5% (14/134) of the negative group, 5.2% (7/134) of the positive group, and 32.8% (22/67) of the high-positive group (p=0.000) (Figure 6A).
A significant positive correlation was observed between SARS-CoV-2 IgG levels and all three ANA parameters (anti-dsDNA, anti-ENA, anti-Hep-2) (Figure 4B-6B). Higher SARS-CoV-2 IgG levels were associated with higher ANA levels across all assays (p=0.000).
Discussion
In this study, we investigated the relationship between SARS-CoV-2-specific antibody levels and ANA positivity in individuals with mild to moderate COVID-19. Our findings showed that ANA positivity was more frequent among those with very high anti-SARS-CoV-2 IgG levels, whereas individuals with moderate antibody responses exhibited the lowest ANA positivity rates. This pattern indicates that the association between virus-specific antibody magnitude and ANA production is more complex than initially expected. Extremely elevated antibody levels may reflect an immune environment in which autoantigen release, nuclear material exposure, or antibody cross-reactivity becomes more pronounced, potentially facilitating ANA generation.
High SARS-CoV-2 antibody levels have been associated with robust immune activation characterized by intensive B-cell stimulation within germinal centers, strong cytokine release, and the development of a broader inflammatory response (17,18). Such conditions have been reported to favor the emergence of autoreactive clones, thereby increasing the likelihood of autoantibody production (19). The precise mechanisms driving the emergence of autoantibodies in individuals with strong SARS-CoV-2 antibody responses are not fully understood but may include bystander activation (20), molecular mimicry (21-25), and epitope spreading in conjunction with NETosis (26-28).
An unexpected finding of this study was that individuals with moderate SARS-CoV-2 antibody levels exhibited lower ANA positivity rates than those in both the negative and high-positive groups. ANA positivity in the general healthy population has been reported to range between 5% and 15% (29), which aligns with the rates observed in our negative group. The lower ANA positivity in individuals with moderate specific antibodies, compared to the negative or healthy population, is particularly noteworthy. Although antibody formation is typically regarded as a sign of immune dysregulation, current evidence is insufficient to conclude that lower ANA levels reflect a better-functioning immune system. Hansen et al. (30) demonstrated that moderate antibody responses were more often associated with milder disease, whereas very high antibody titers were more often associated with severe disease. These findings suggest that high antibody production may not always be protective to the expected extent, whereas moderate antibody responses may be linked to a more favorable clinical course. Given that ANA may aggravate clinical symptoms, our results are consistent with these observations. Nevertheless, the limited number of studies addressing this issue highlights the need for further molecular-level investigations to better characterize the relationship between antibody responses and autoantibody formation.
This study has some limitations. Its retrospective design did not allow assessment of whether ANA positivity contributed to autoimmune reactions in the participants. Furthermore, other autoantibodies were not evaluated. However, considering that ANA is the most common type of autoantibody and is frequently found in conjunction with other autoantibodies, its assessment was deemed sufficient to test the hypothesis. Another limitation is that cross-reactivity could not be directly assessed because the ELISA-based autoantibody results were not confirmed with more specific methods, such as indirect immunofluorescence assay (IFA) or immunoblot, due to laboratory constraints. Although the ANA assays were validated and showed high concordance with diagnostic kits, the possibility of nonspecific binding related to molecular mimicry or immune activation cannot be entirely excluded. In addition, complete demographic data were not available for all individuals in the high-positive group. Demographic characteristics were accessible for 44 out of 67 individuals, and ANA positivity was consistently high in this subset; missing demographic information for the remaining participants may limit subgroup-level interpretations.
The study also has several strengths. It is, to our knowledge, the first to provide a new perspective on the relationship between SARS-CoV-2-specific antibody magnitude and ANA formation. Obtaining samples with very high antibody titers required extensive screening, which is another strength. Additionally, the inclusion of the Hep-2 cell nucleus test alongside dsDNA and ENA assays strengthened ANA detection, as the Hep-2 assay identifies autoantibodies that may not be captured by the other two methods.
This study, the first to investigate the relationship between SARS-CoV-2-specific antibody production and ANA positivity, demonstrates that individuals with very high anti-SARS-CoV-2 IgG levels may be at increased risk of developing autoantibodies. Moreover, individuals with moderate antibody responses had lower ANA positivity rates than those in the negative group. Although current knowledge on the link between antiviral antibody responses and ANA development remains limited, these findings highlight the need for detailed molecular-level studies to clarify the underlying mechanisms.