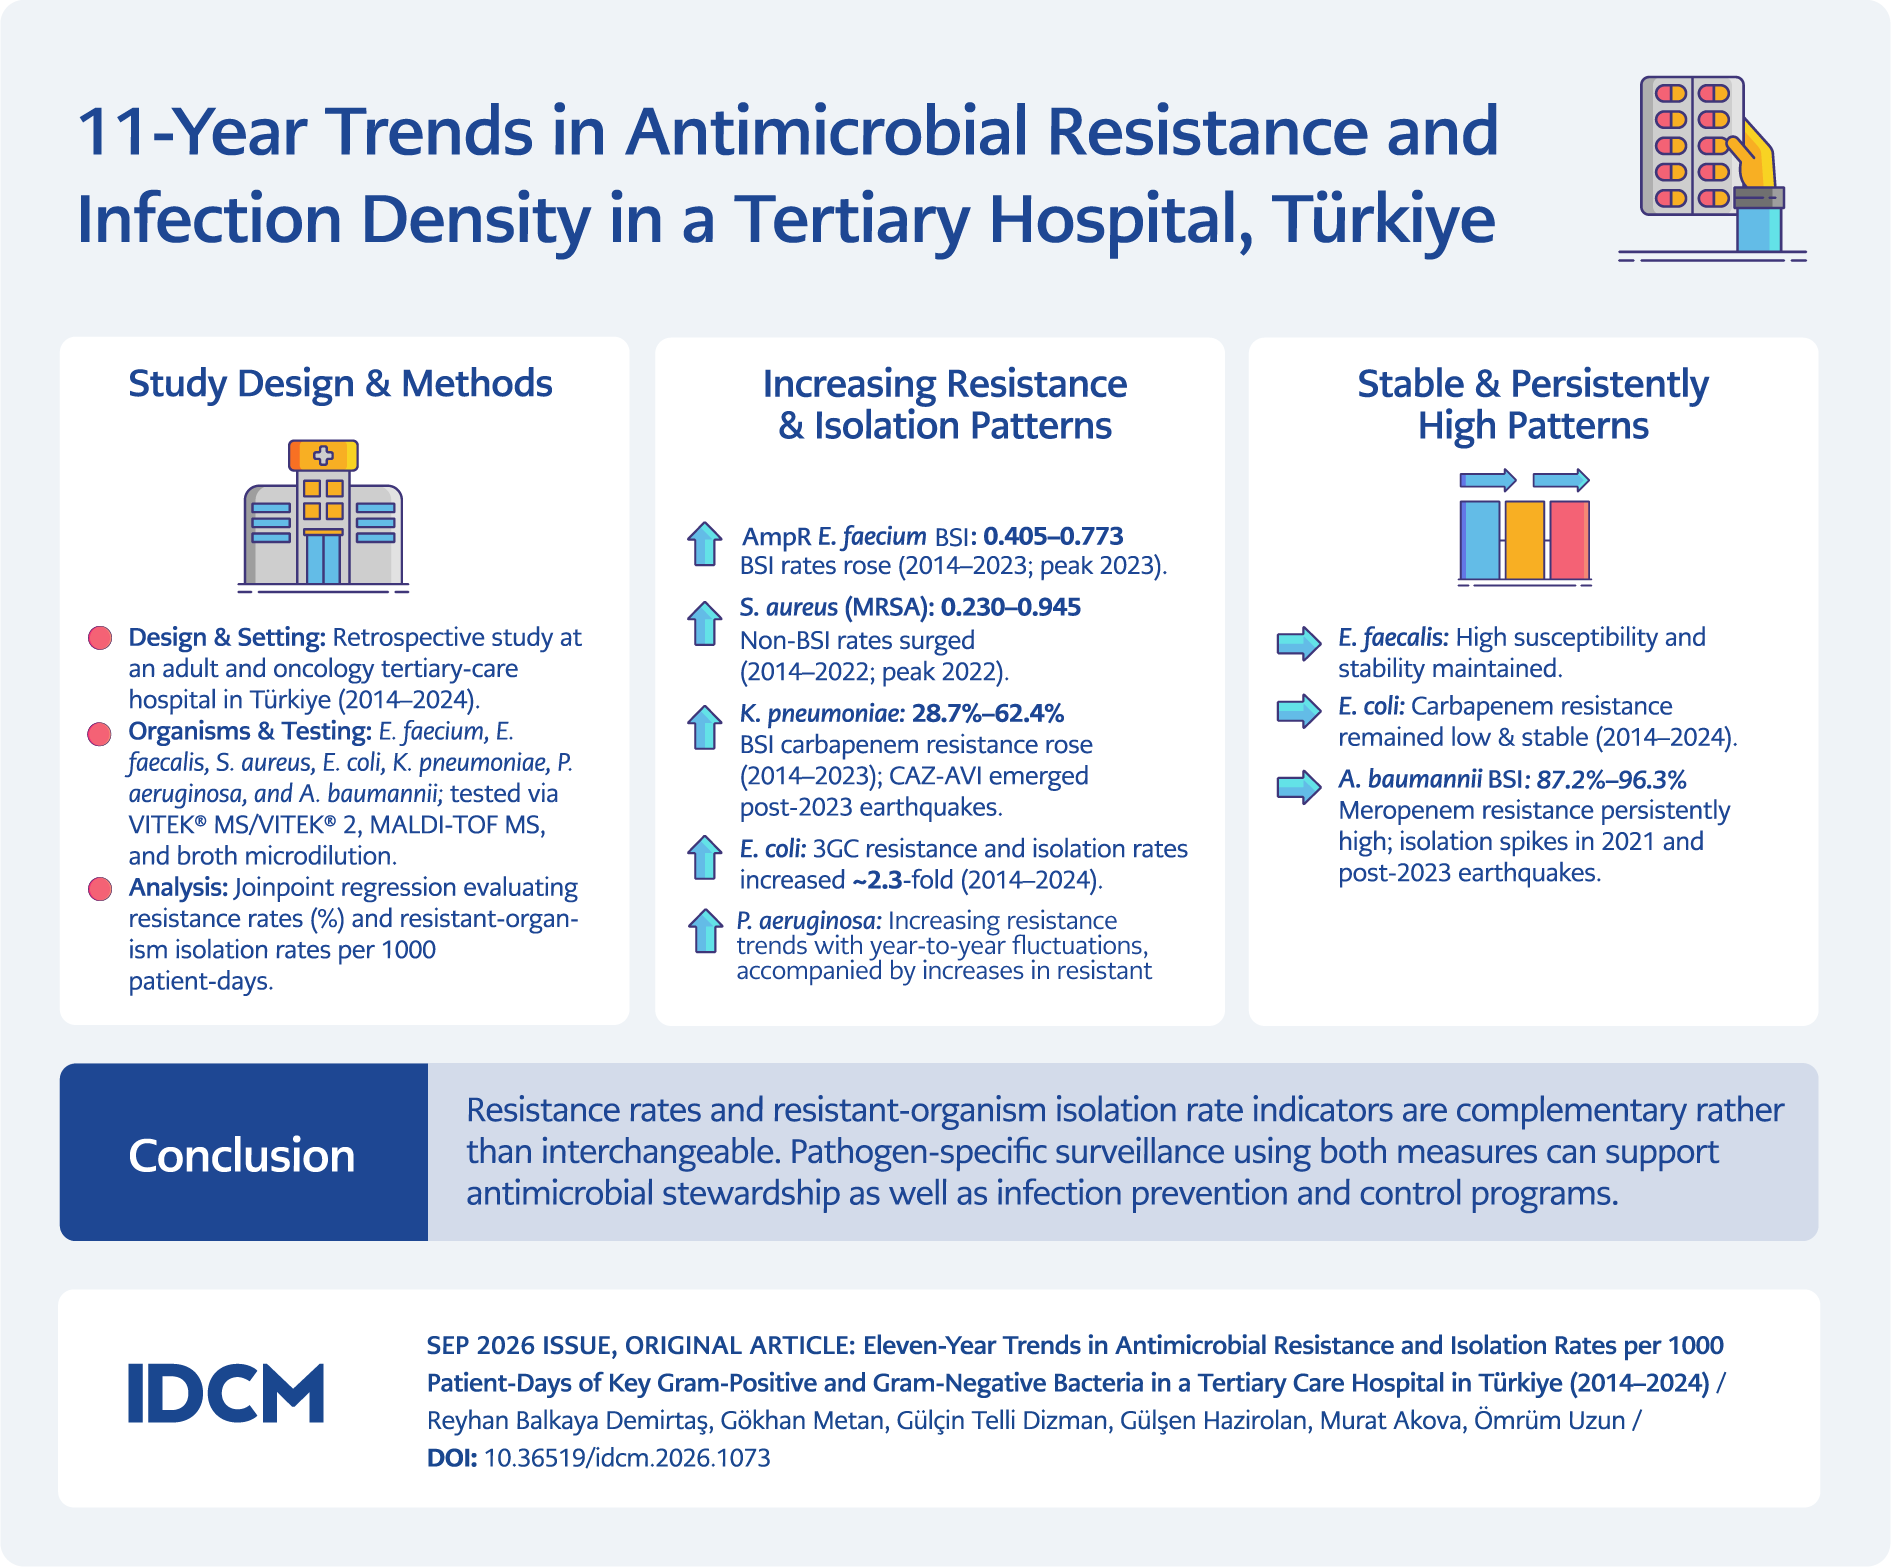
Graphical Abstract
Introduction
Antimicrobial resistance (AMR) is a critical global health threat, contributing to increased mortality and substantial economic costs. The World Bank has projected an additional USD 1 trillion in healthcare costs by 2050 (1,2). In 2022, the World Health Organization Global Antimicrobial Resistance and Use Surveillance System (WHO GLASS) report revealed alarming resistance rates across 76 countries, including 42% resistance to third-generation cephalosporins among Escherichia coli and 35% methicillin resistance among Staphylococcus aureus (3). Similarly, Türkiye’s 2024 national surveillance report on healthcare-associated bloodstream infections reported high resistance rates, with carbapenem resistance reaching 93.7% in Acinetobacter baumannii, 51.8% in Pseudomonas aeruginosa, and 69.4% in Klebsiella pneumoniae (4). More than half (55.5%) of S. aureus isolates were methicillin-resistant, and 19.5% of Enterococcus faecium isolates were vancomycin-resistant.
In this study, we analyzed 11-year secular trends in antimicrobial resistance rates and resistant organism isolation rates per 1000 patient-days for selected Gram-positive and Gram-negative bacteria isolated from medical wards and intensive care units (ICUs) in a Turkish tertiary-care hospital. We also compared these metrics as quality indicators for antimicrobial stewardship (AMS) and infection prevention and control programs.
Materials and Methods
This study was conducted at a tertiary-care center, the University Adult and Oncology Hospitals, in Türkiye (1040 beds in total, including 143 ICU beds; the oncology hospital had 119 beds, including an eight-bed ICU and a 16-bed hematopoietic stem cell transplant unit). Data from the Hospital Information Management System covering January 2014–December 2024 were analyzed retrospectively. Resistance rates and resistant organism isolation rates were stratified by specimen type: bloodstream (including blood and central venous catheter cultures) versus non-bloodstream isolates (including urine, sputum, tracheal aspirates, purulent discharge, open wounds, and pleural and peritoneal samples, listed in decreasing order of frequency). Only the first isolate per episode, obtained after 48 hours of hospitalization, was included.
Bacterial identification and antimicrobial susceptibility testing were performed using VITEK® MS (bioMérieux, Marcy-l’Étoile, France) and VITEK® 2 Compact (bioMérieux, Marcy-l’Étoile, France) (MS v.2.0 database from 2014 to 2016, v.3.0 from 2016 to 2018) until 2018; from 2019 onward, matrix-assisted laser desorption ionization-time-of-flight mass spectrometry (MALDI-TOF MS) and BD Phoenix (Becton Dickinson, Sparks, MD, USA) were used. Carbapenem-resistant isolates underwent minimum inhibitory concentration (MIC) confirmation using gradient diffusion (E-test® bioMérieux, Marcy-l’Étoile, France). Colistin MICs were determined by gradient strip testing before 2018 and broth microdilution from 2018 onward, upon clinician request. Antimicrobial susceptibility testing results were interpreted according to Clinical and Laboratory Standards Institute (CLSI) guidelines until 2015 and according to European Committee on Antimicrobial Susceptibility Testing (EUCAST) guidelines thereafter, with standard reference strains used for quality control. Laboratory protocol changes included replacing ceftazidime reporting (2014–2018) with ceftriaxone (2019 onward) for Enterobacterales; introducing ceftazidime-avibactam testing in 2020; and performing routine testing for all K. pneumoniae bloodstream isolates since 2021. Annual EUCAST breakpoint updates were implemented in our laboratory system.
Resistance rates were assessed against predefined antibiotic panels selected based on clinical relevance: cefoxitin and trimethoprim-sulfamethoxazole for S. aureus; ampicillin, high-dose gentamicin, and vancomycin for Enterococcus spp.; meropenem and colistin for A. baumannii; third-generation cephalosporins (3GC), piperacillin-tazobactam, meropenem, amikacin, and ciprofloxacin for P. aeruginosa; and the same panel plus trimethoprim-sulfamethoxazole for E. coli and K. pneumoniae, with ceftazidime-avibactam and colistin additionally tested for K. pneumoniae.
Statistical Analysis
Resistant organism isolation rates per 1000 patient-days were calculated using OpenEpi, version 3.01 (5). To analyze temporal trends in antimicrobial resistance rates and resistant organism isolation rates over time, we used joinpoint regression analysis (Joinpoint Trend Analysis Software, version 6.0.1.0, National Cancer Institute, USA), a statistical method that fits a series of connected line segments to the data (6,7). This approach identifies specific points in time, termed joinpoints, where the trend slope changes significantly, allowing identification of periods when resistance rates increased, decreased, or changed in magnitude over the study period. Model selection was based on the weighted Bayesian information criterion. For each identified trend segment, the joinpoint year and its 95% confidence interval (CI), segment-specific slopes, and corresponding p values were reported. For models with one joinpoint, the difference between the pre- and post-joinpoint slopes was also evaluated. A two-sided p value of < 0.05 was considered statistically significant.
Results
Antimicrobial Resistance Rates
Enterococcus species
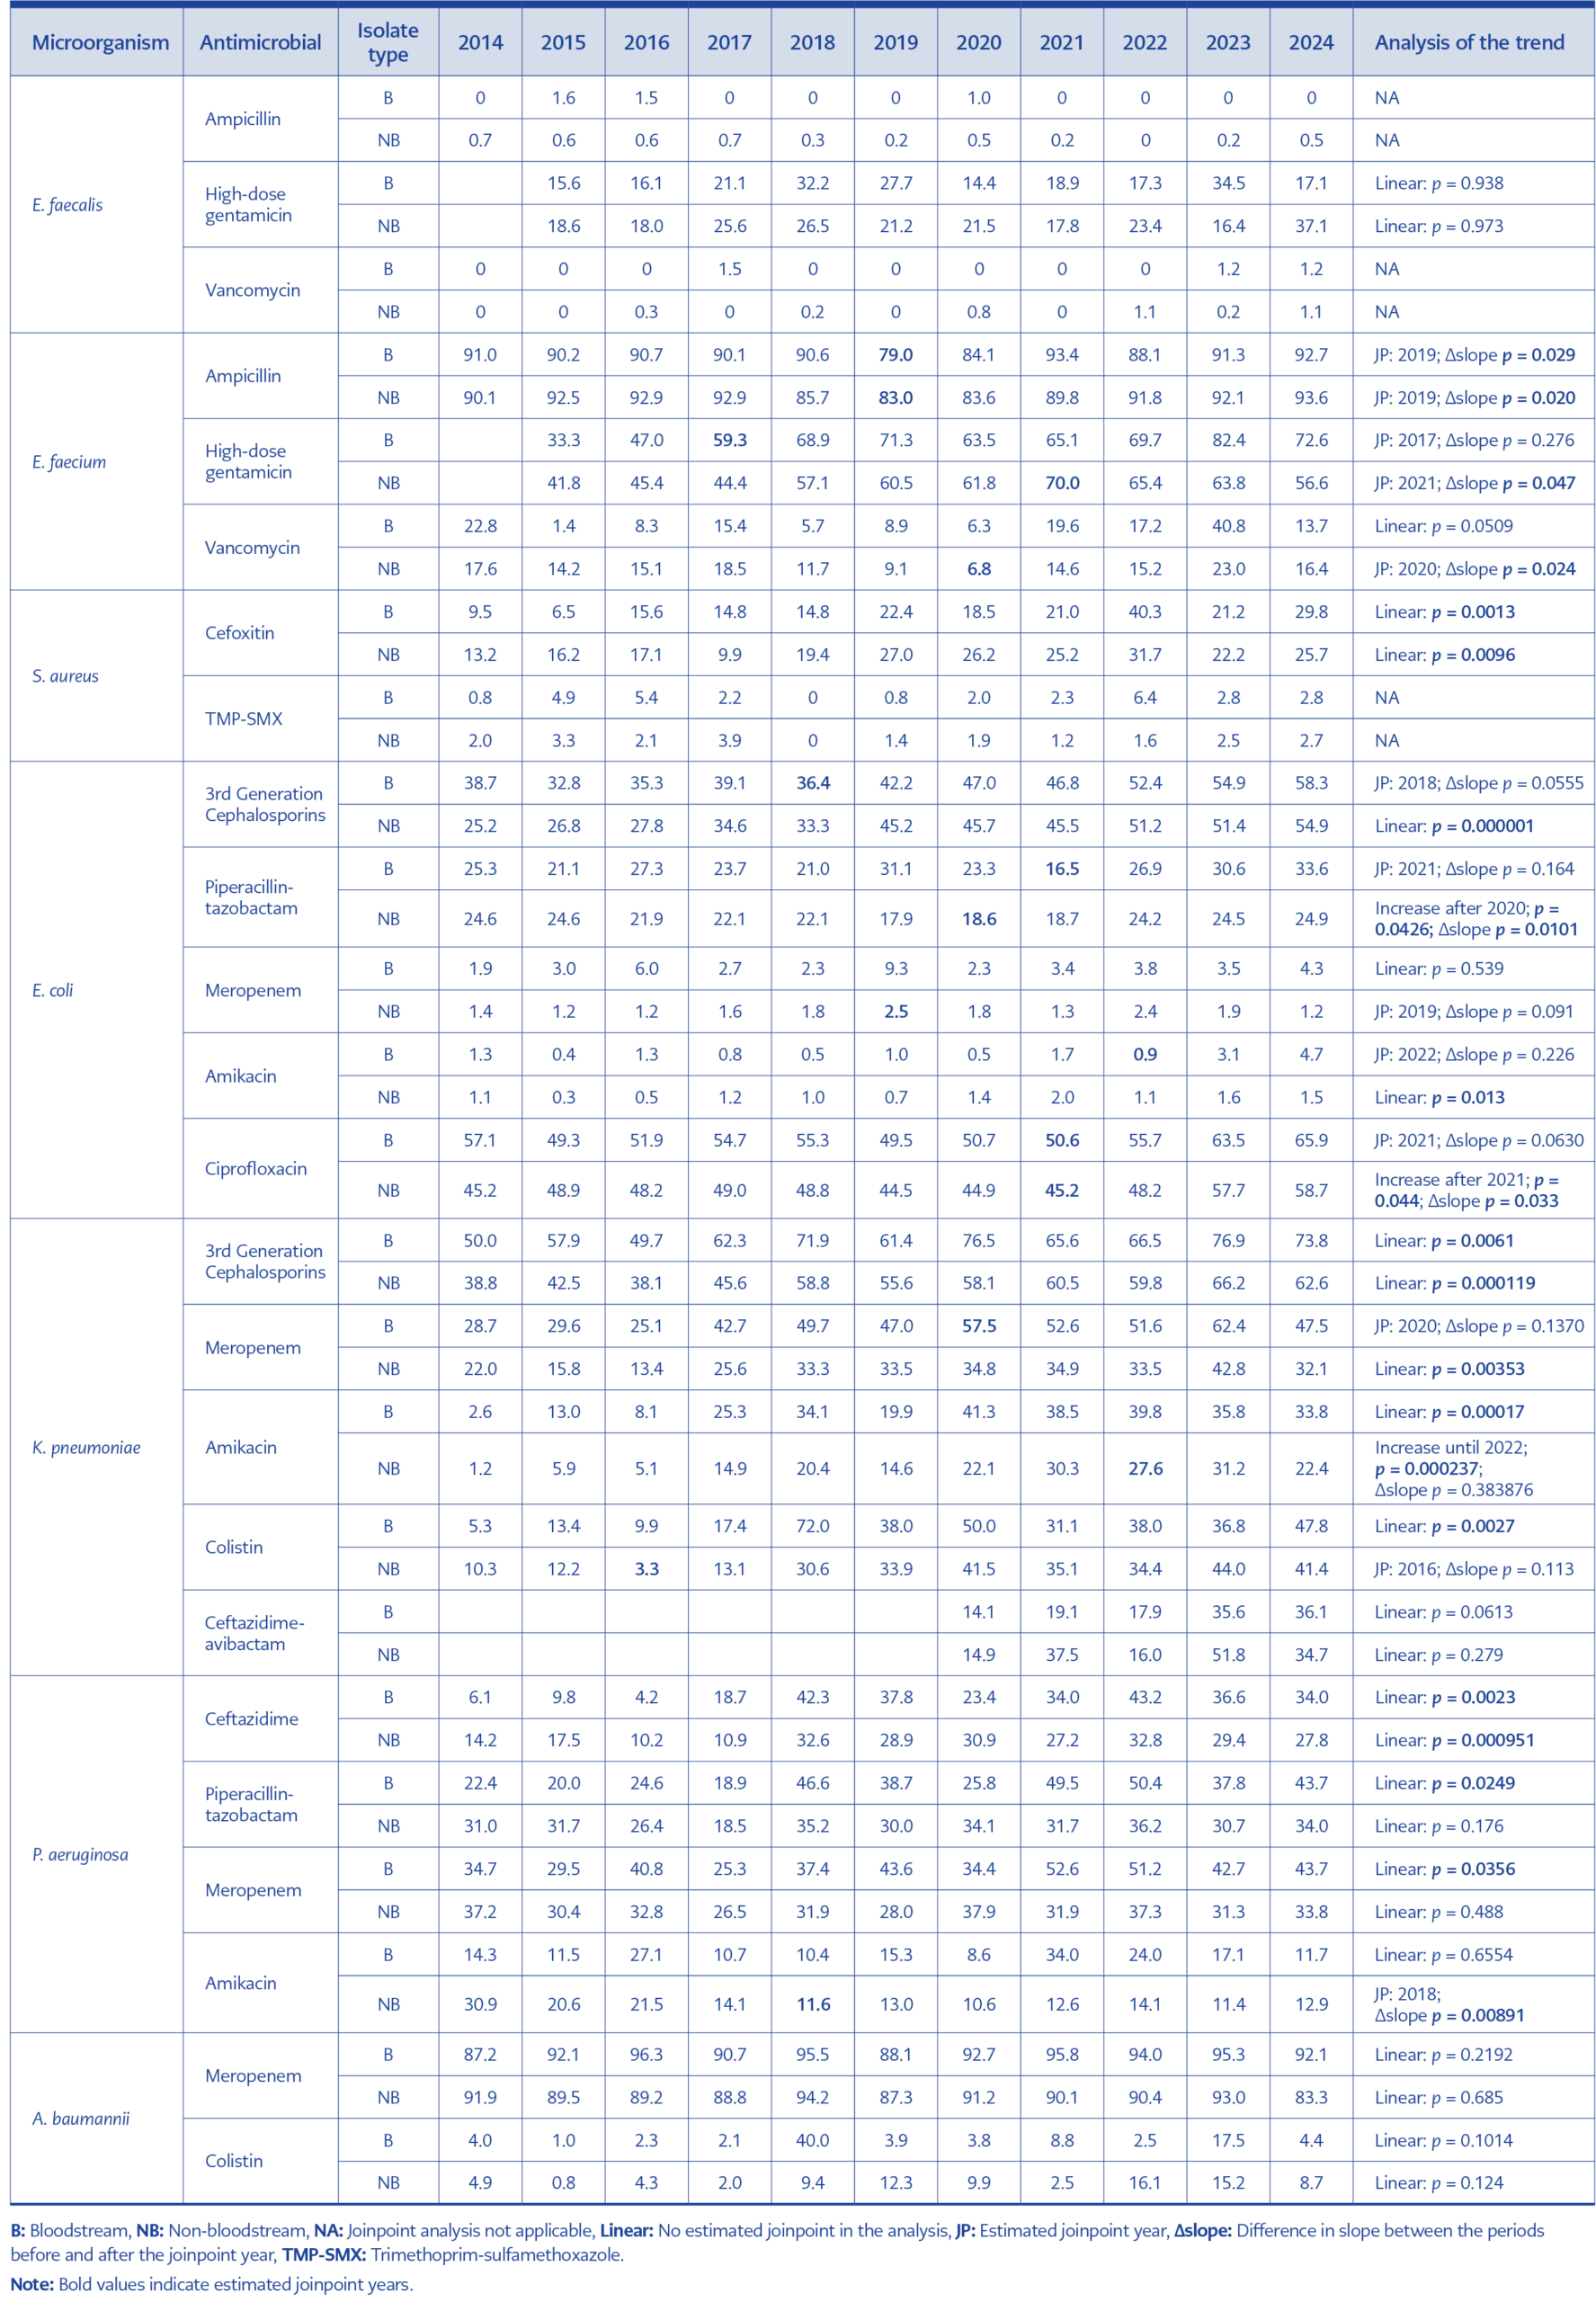
Table 1. Antimicrobial resistance rates among microorganisms isolated from bloodstream and non-bloodstream specimens (%) and estimated joinpoints, where applicable, from joinpoint regression analysis.
Resistance rates in E. faecalis remained largely stable; joinpoint analysis could not be performed for ampicillin and vancomycin due to consistently low resistance, and high-dose gentamicin showed no significant trend (Table 1, Figures S1–S2).
E. faecium exhibited persistently high ampicillin resistance, with joinpoint analysis identifying a significant post-2019 acceleration in both bloodstream and non-bloodstream isolates (p = 0.029 and p = 0.020) (Figures S3–S4). High-dose gentamicin resistance in bloodstream isolates increased from 33.3% to 72.6% without a significant slope change (p = 0.276) (Figure S5), whereas resistance in non-bloodstream isolates peaked in 2021, with a significant joinpoint identified (p = 0.047) (Figure S6). Vancomycin resistance showed a borderline increasing trend in bloodstream isolates (p = 0.0509) (Figure S7) and a significant post-2020 rebound in non-bloodstream isolates (p = 0.024) (Figure S8).
Staphylococcus aureus
Methicillin resistance in S. aureus increased significantly, rising approximately threefold in bloodstream isolates (9.5% to 29.8%; p = 0.0013) and twofold in non-bloodstream isolates (13.2% to 25.7%; p = 0.0096) over the study period (Figures S9–S10). Trimethoprim-sulfamethoxazole resistance was too low for regression analysis (Table 1).
Escherichia coli
In bloodstream isolates, 3GC resistance in E. coli increased from 38.7% to 58.3% in 2024 (joinpoint: 2018; p = 0.0555) (Figure S11), and ciprofloxacin resistance increased from 57.1% to 65.9% (joinpoint: 2021; p = 0.0630) (Figure S19). Piperacillin-tazobactam resistance was variable (joinpoint: 2021; p = 0.164) (Figure S13), while meropenem and amikacin resistance remained low with no significant trends (p = 0.539; p = 0.226) (Figures S15, S17).
In non-bloodstream isolates, 3GC resistance increased most markedly, more than doubling from 25.2% to 54.9% (p = 0.000001) (Figure S12). Ciprofloxacin resistance increased from 45.2% to 58.7%, with significant post-2021 acceleration (p = 0.033) (Figure S20). Piperacillin-tazobactam resistance increased significantly after 2020 (slope difference p = 0.0101), reaching 24.9% by 2024 (Figure S14). Amikacin resistance, though persistently low (0.3–2.0%), showed a significant increasing trend (p = 0.013) (Figure S18). Meropenem resistance remained very low (1.2–2.5%) throughout (Figure S16).
Klebsiella pneumoniae
In bloodstream isolates, 3GC resistance increased significantly from 50.0% to 73.8% (p = 0.0061) (Figure S21). Amikacin resistance increased dramatically from 2.6% to 33.8% (p = 0.00017) (Figure S25). Colistin resistance showed a statistically significant increasing trend (p = 0.0027), with particularly high rates in 2018 (72.0%) (Figure S27). Meropenem resistance increased from 28.7% to 47.5%, with an estimated joinpoint in 2020, though the change in slope was non-significant (p = 0.137) (Figure S23). Ceftazidime-avibactam resistance, which was assessed from 2020 onward, reached 36.1% by 2024 (p = 0.0613) (Figure S29).
In non-bloodstream isolates, 3GC resistance increased from 38.8% to 62.6% (p = 0.000119) (Figure S22), and meropenem resistance increased from 22.0% to 32.1% (p = 0.00353) (Figure S24). Amikacin resistance increased from 1.2% to 31.2% (p = 0.000237), with a possible recent plateau (Figure S26). Colistin resistance increased steeply after a 2016 joinpoint to reach 41.4% (p = 0.113) (Figure S28). Ceftazidime-avibactam resistance was variable (14.9–51.8%) with no significant trend (p = 0.279) (Figure S30).
Pseudomonas aeruginosa
P. aeruginosa showed significant resistance increases in bloodstream isolates: ceftazidime increased from 6.1% to 34.0% (p = 0.0023) (Figure S31), piperacillin-tazobactam from 22.4% to 43.7% (p = 0.0249) (Figure S33), and meropenem from 34.7% to 43.7% (p = 0.0356) (Figure S35). Amikacin showed no significant trend (p = 0.6554) (Figure S37).
In non-bloodstream isolates, ceftazidime resistance increased significantly from 14.2% to 27.8% (p = 0.000951) (Figure S32), while piperacillin-tazobactam and meropenem fluctuated without significant trends (Figures S34, S36). Amikacin resistance declined significantly from 30.9% to 12.9%, with a joinpoint at 2018 (p = 0.00891) (Figure S38).
Acinetobacter baumannii
A. baumannii exhibited persistently high meropenem resistance throughout the study period in both bloodstream (87.2–96.3%, p = 0.2192) (Figure S39) and non-bloodstream isolates (83.3–94.2%, p = 0.685) (Figure S40), indicating resistance was established prior to the observation period. Colistin resistance fluctuated in bloodstream isolates, peaking at 40.0% in 2018, without a significant trend (p = 0.1014) (Figure S41). Similarly, non-bloodstream colistin resistance showed no significant trend (p = 0.124), ranging from 0.8% to 16.1%, with peaks in 2022 (16.1%) and 2023 (15.2%) (Figure S42).
Resistant Microorganism Isolation Rates per 1000 Patient-Days
Enterococcus species
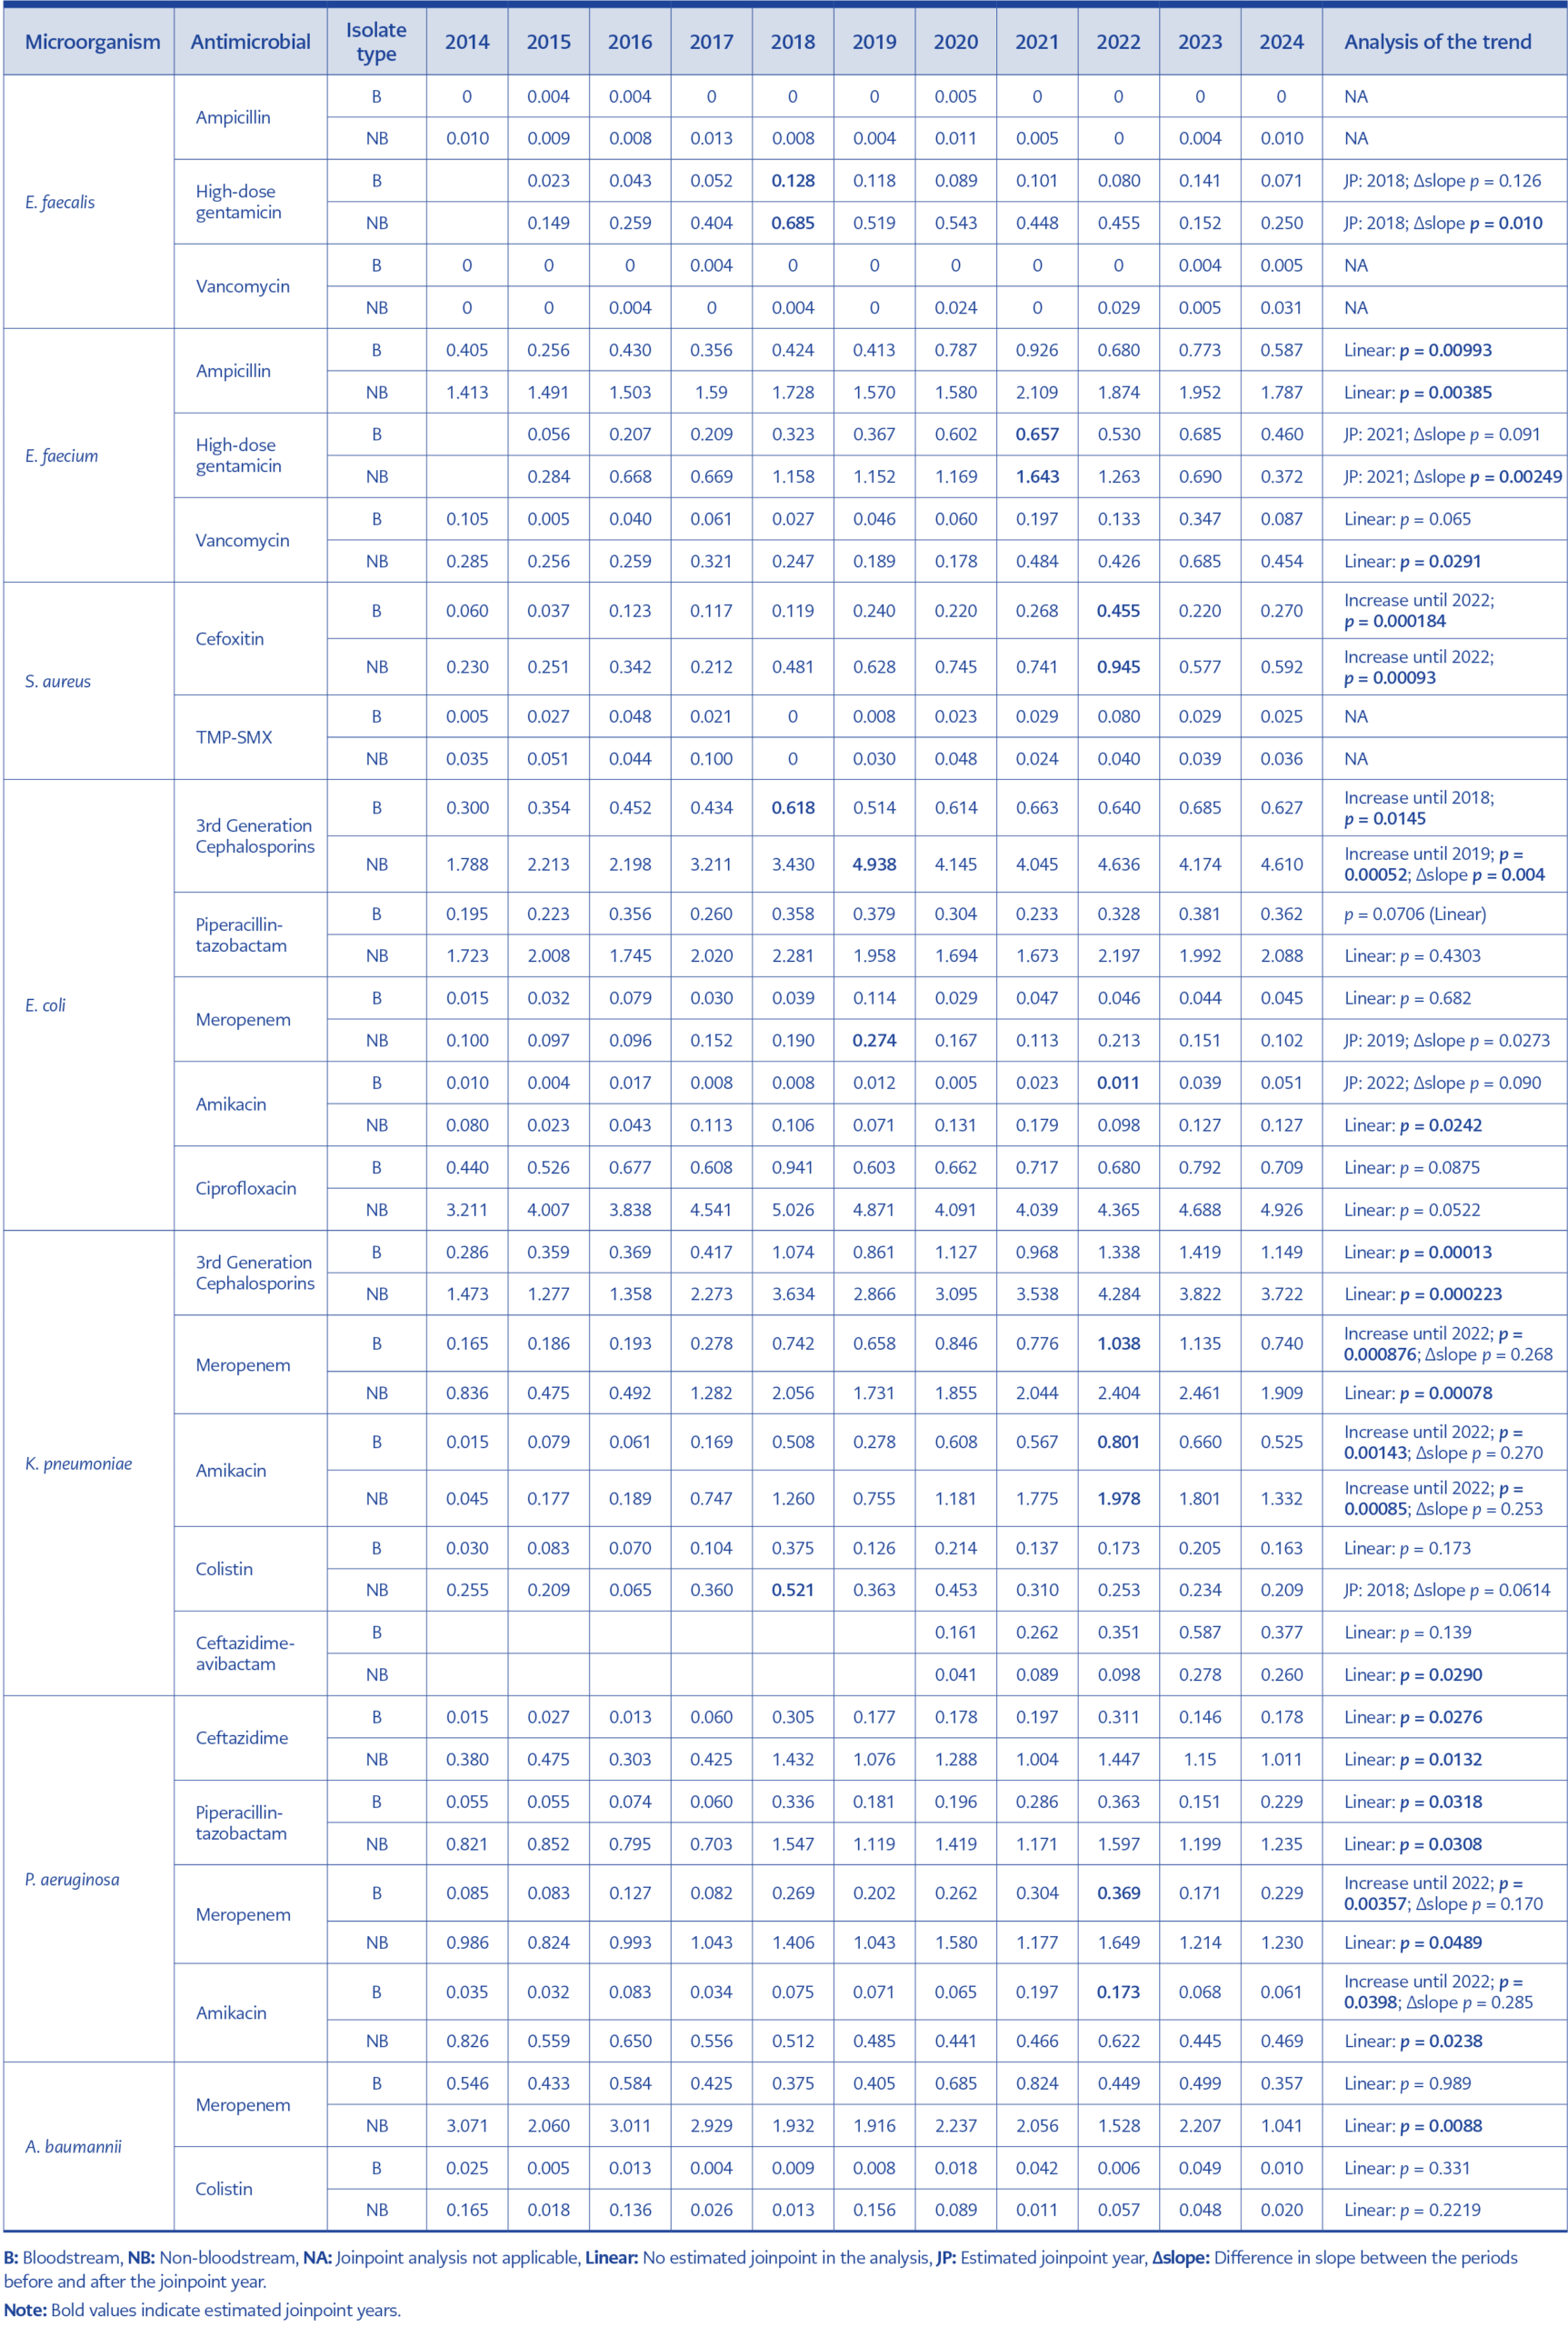
Table 2. Isolation rates of antibiotic-resistant microorganisms from bloodstream and non-bloodstream specimens per 1000 patient-days and estimated joinpoints, where applicable, from joinpoint regression analysis.
The isolation rates of ampicillin- and vancomycin-resistant E. faecalis remained near zero (Table 2). The isolation rate of high-dose gentamicin-resistant E. faecalis showed no significant trend in bloodstream isolates (p = 0.126); however, among non-bloodstream cultures, the trend showed a joinpoint around 2018 (p = 0.01), with an increase until 2018 and a decrease after that year (Figures S43, S44).
The isolation rate of ampicillin-resistant E. faecium showed significant increases in both bloodstream isolates (0.405 to a peak of 0.926, p = 0.00993) (Figure S45) and non-bloodstream cultures (1.413 to a peak of 2.109, p = 0.00385) (Figure S46), although both rates declined by 2024. The high-dose gentamicin-resistant E. faecium isolation rate in bloodstream isolates showed a non-significant joinpoint in 2021 (p = 0.091) (Figure S47), while the isolation rate in non-bloodstream cultures demonstrated a significant joinpoint in 2021 (p = 0.00249), rising to 1.643 and then falling sharply to 0.372 (Figure S48). The vancomycin-resistant E. faecium isolation rate remained non-significant in bloodstream isolates (p = 0.065) (Figure S49) but increased significantly in non-bloodstream cultures from 0.285 to 0.454 (p = 0.0291), surging to 0.685 in 2023 (Figure S50).
Staphylococcus aureus
Methicillin-resistant Staphylococcus aureus (MRSA) isolation rates increased significantly in both bloodstream (0.060 to a peak of 0.455 in 2022, p = 0.000184) (Figure S51) and non-bloodstream cultures (0.230 to a peak of 0.945 in 2022, p = 0.00093) (Figure S52), followed by partial declines in both groups by 2024, reaching 0.592.
Escherichia coli
3GC-resistant E. coli isolation rates in blood cultures increased significantly until a joinpoint in 2018 (0.300 to 0.618 per 1000 patient-days,
p = 0.0145), with continued but non-significant increases thereafter (Figure S53). Piperacillin-tazobactam- (p = 0.0706) and ciprofloxacin-resistant
E. coli (p = 0.0875) isolation rates showed borderline upward trends (Figures S55, S61). Meropenem- and amikacin-resistant isolation rates remained low, with no significant trends (Figures S57, S59).
In non-bloodstream cultures, 3GC-resistant E. coli isolation rates increased sharply until a joinpoint in 2019 (1.788 to 4.938 per 1000 patient-days, p = 0.00052), followed by a significant plateau (difference p = 0.004) (Figure S54). Meropenem-resistant E. coli isolation rates followed an inverse pattern around the same joinpoint, rising initially and subsequently declining to baseline levels (difference p = 0.0273) (Figure S58). Amikacin-resistant E. coli isolation rates increased significantly across the full period (0.080 to 0.127, p = 0.0242) (Figure S60). Ciprofloxacin-resistant E. coli isolation rates showed a borderline upward trend (p = 0.0522) (Figure S62), while piperacillin-tazobactam-resistant E. coli isolation rates remained stable (p = 0.430) (Figure S56).
Klebsiella pneumoniae
In bloodstream isolates, 3GC-resistant K. pneumoniae isolation rates increased significantly (0.286 to 1.149 per 1000 patient-days, p = 0.00013) (Figure S63). Meropenem-resistant K. pneumoniae isolation rates increased dramatically until a joinpoint in 2022, reaching 1.038 (p = 0.000876), before declining non-significantly to 0.740 (Figure S65). Amikacin-resistant K. pneumoniae isolation rates followed a similar pattern, peaking at 0.801 in 2022 (p = 0.00143) before declining to 0.525 (difference, p = 0.270) (Figure S67). Colistin-resistant K. pneumoniae isolation rates showed no significant trend (p = 0.173) (Figure S69). Ceftazidime-avibactam-resistant K. pneumoniae isolation rates increased from 0.161 to a 2023 peak of 0.587 before declining to 0.377, without significance (p = 0.139) (Figure S71).
In non-bloodstream cultures, 3GC-resistant K. pneumoniae isolation rates more than doubled (1.473 to 3.722 per 1000 patient-days, p = 0.000223), with an accelerated increase from 2017 onward (Figure S64). Meropenem-resistant K. pneumoniae isolation rates increased significantly (0.836 to 1.909, p = 0.00078), plateauing around 2.0–2.5 from 2019 (Figure S66). Amikacin-resistant K. pneumoniae isolation rates surged to a 2022 peak of 1.978 (p = 0.00085) before declining non-significantly to 1.332 (Figure S68). Colistin-resistant K. pneumoniae isolation rates showed a borderline joinpoint in 2018 (difference p = 0.0614), rising then returning toward baseline (Figure S70). Ceftazidime-avibactam-resistant K. pneumoniae isolation rates increased significantly over the available window (0.041 to 0.260 per 1000 patient-days, p = 0.0290) (Figure S72).
Pseudomonas aeruginosa
Ceftazidime-resistant P. aeruginosa isolation rates in bloodstream isolates increased from 0.015 to 0.178 per 1000 patient-days (p = 0.0276) (Figure S73), and piperacillin-tazobactam-resistant P. aeruginosa isolation rates increased from 0.055 to 0.229 (p = 0.0318) (Figure S75). Meropenem-resistant P. aeruginosa isolation rates increased approximately fourfold to a 2022 peak of 0.369 (p = 0.00357) before declining non-significantly to 0.229 (Figure S77). Amikacin-resistant P. aeruginosa isolation rates similarly peaked at 0.173 in 2022 (p = 0.0398) before falling to 0.061 (Figure S79).
In non-bloodstream cultures, ceftazidime-resistant P. aeruginosa isolation rates nearly tripled (0.380 to 1.011, p = 0.0132) (Figure S74), piperacillin-tazobactam-resistant P. aeruginosa isolation rates increased from 0.821 to 1.235 (p = 0.0308) (Figure S76), and meropenem-resistant P. aeruginosa isolation rates increased from 0.986 to 1.230 (p = 0.0489) (Figure S78). Amikacin-resistant P. aeruginosa isolation rates declined significantly from 0.826 to 0.469
(p = 0.0238) (Figure S80).
Acinetobacter baumannii
Meropenem-resistant A. baumannii isolation rates in bloodstream isolates remained high and stable (0.357–0.824 per 1000 patient-days, p = 0.989) (Figure S81), whereas colistin-resistant isolation rates fluctuated without significant trend (p = 0.331) (Figure S83).
In non-bloodstream cultures, meropenem-resistant A. baumannii isolation rates declined significantly by nearly two-thirds, from 3.071 in 2014 to 1.041 in 2024 per 1000 patient-days (p = 0.0088) (Figure S82). Colistin-resistant A. baumannii isolation rates showed no significant trend (p = 0.2219), with high variability throughout (Figure S84).
Discussion
This study evaluated resistance trends and resistant organism isolation rates from both bloodstream and non-bloodstream cultures over an 11-year period. The most consistent finding across both specimen types was a significant and sustained increase in resistance among E. faecium, S. aureus, E. coli, and K. pneumoniae, and to a lesser extent P. aeruginosa, reflecting a system-wide deterioration in antimicrobial susceptibility regardless of culture type.
Vancomycin resistance rates in E. faecium were lower than those reported in Turkish national surveillance data for 2022 (17.2% and 21.3%, respectively) (8) but were higher in 2023 (40.8% and 23.5%, respectively) (9), with a sharp decrease (13.7%) in 2024 (Figures S7 and S8). Routine vancomycin-resistant Enterococcus (VRE) screening was discontinued at our hospital in 2016 and has since been performed only under specific circumstances, such as when case clustering is observed or when patients are admitted with a history of ICU stay within the preceding three months. Contact precautions for patients colonized or infected with VRE have been maintained in accordance with Centers for Disease Control and Prevention (CDC) recommendations (10). The increased VRE rate observed at our hospital may be partly attributable to an outbreak detected in an ICU in 2021 (11), which required approximately three years to bring under control. Another potential explanation for the 2023 peak is our hospital’s role as a reference center for patients affected by the 2023 Kahramanmaraş earthquakes. An outbreak of vancomycin-resistant enterococci involving infants transferred following the earthquakes has also recently been reported in Türkiye (12).
Methicillin resistance in S. aureus showed the most pronounced upward trajectory over the study period, with rates per 1000 patient-days rising significantly until 2022 — the estimated joinpoint — followed by a partial decline. In bloodstream isolates, the increase was highly significant
(p = 0.000184), with rates rising more than sevenfold from 0.060 to a peak of 0.455 in 2022, before declining to 0.270 in 2024. In non-bloodstream cultures, rates similarly increased significantly
(p = 0.00093) from 0.230 in 2014 to a peak of 0.945 in 2022, declining to 0.592 in 2024. The concordance of the joinpoint year and directional trends across both datasets suggests a shared institutional MRSA dynamic, while the post-2022 decline may reflect the impact of enhanced infection prevention measures or a reduction in the number of patients with COVID-19. Whether the clustering of MRSA cases observed in 2022 reflects a true outbreak or is partly attributable to the COVID-19 pandemic remains unclear. Supporting the latter possibility, a propensity score-matched cohort study of over 128,000 patients demonstrated that COVID-19 was associated with a significantly higher risk of secondary MRSA infection (hazard ratio [HR] 1.52; 95% CI 1.19–1.94) and MRSA bacteremia (HR 1.43; 95% CI 1.16–1.75) within one month compared with influenza, a finding that remained consistent across multiple time frames (13).
Carbapenem resistance in A. baumannii has been a prolonged problem in our hospital. The peak coinciding with the COVID-19 pandemic aligns with well-documented drivers of A. baumannii outbreaks during the pandemic, including increased ICU occupancy, prolonged mechanical ventilation, and broader antibiotic use (14). A clonal outbreak of colistin- and meropenem-resistant A. baumannii was detected in our hospital in 2016. The multimodal infection prevention response successfully controlled its spread and reduced other resistant infections in the affected ICU (15). However, the long-term sustainability of such programs remains challenging, as evidenced by the fluctuating meropenem-resistant A. baumannii rates in non-bloodstream cultures over the study period (Table 2). The Turkish Ministry of Health reported 93.7% meropenem resistance among A. baumannii bloodstream isolates (4). These persistently high rates reflect regional trends observed since 2009 (16) and are consistent with international data, such as a seven-year Italian study reporting meropenem resistance of 97.7% in 2024 (17).
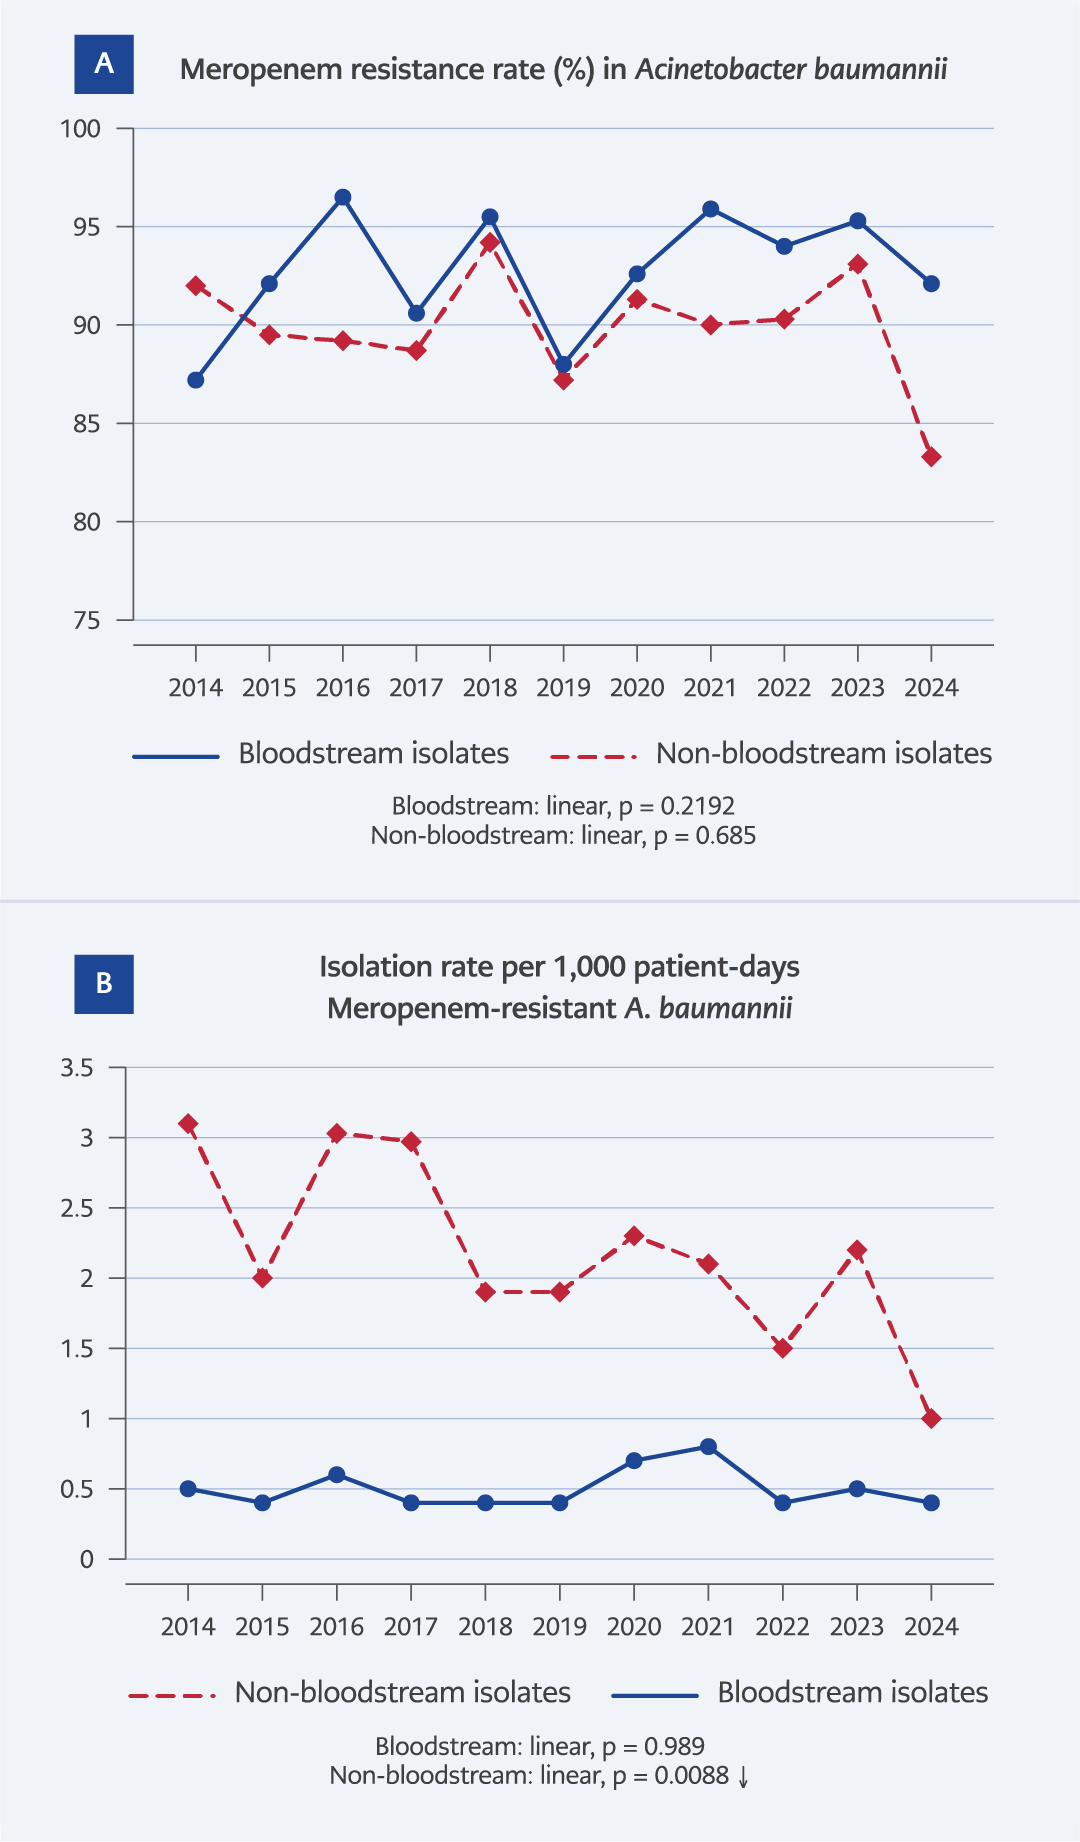
Figure 1. Annual trends in meropenem resistance rates and isolation rates of meropenem-resistant Acinetobacter baumannii per 1000 patient-days among bloodstream and non-bloodstream isolates, 2014–2024. Trend significance was determined using joinpoint regression analysis. A p < 0.05 was considered statistically significant.
Figure 1A. Meropenem resistance rates (%). No statistically significant trend was observed in either isolate group during the 2014–2024 study period (p = 0.2192 and p = 0.685, respectively).
Figure 1B. Isolation rates per 1000 patient-days. A statistically significant decreasing trend was observed among non-bloodstream isolates (p = 0.0088), whereas no significant trend was observed among bloodstream isolates (p = 0.989).
A. baumannii was the only organism showing clearly divergent trends between resistance rates and resistant organism isolation rates. While meropenem resistance rates remained stable over time (Figure 1A), the isolation rate of meropenem-resistant
A. baumannii in non-bloodstream cultures declined significantly (p = 0.0088), falling nearly two-thirds from 3.071 in 2014 to 1.041 per 1000 patient-days in 2024 (Figure 1B). This discrepancy highlights that tracking resistance rates alone may be insufficient to capture epidemiological shifts, particularly for endemic multidrug-resistant organisms.
K. pneumoniae remains a formidable pathogen, underscored by its heightened prioritization in the 2024 WHO bacterial priority pathogens list (18). Turkish national data show meropenem resistance in bloodstream isolates rising from 62.9% in 2021 (19) to 69.4% in 2024 (4). Our local analysis shows a progressive increase in resistance across sample types, with carbapenem resistance in K. pneumoniae peaking after the 2023 earthquake, likely reflecting a period of healthcare-system fragility (Table 1). Meropenem resistance reached statistical significance in non-bloodstream isolates (p = 0.00353) but not in bloodstream isolates, whereas colistin resistance showed the reverse pattern, with a significant trend in bloodstream (p = 0.0027) but not in non-bloodstream isolates (p = 0.113). Colistin trends should be interpreted cautiously because of selective testing and methodological changes, and the study design precludes causal inference. Nonetheless, a monoclonal outbreak of carbapenem- and colistin-resistant K. pneumoniae was detected in our hospital in 2015 (20). Molecular characterization of isolates from 2017–2019 revealed the dominance of a single clone (ST101 carrying blaOXA-48), suggesting that clonal dissemination rather than horizontal gene transfer is the primary driver of the high carbapenem-resistant K. pneumoniae burden (21).
Ceftazidime-avibactam-resistant K. pneumoniae isolation rates increased significantly in non-bloodstream cultures (p = 0.0290; 0.041 to 0.260), whereas the increase in bloodstream isolates did not reach statistical significance (p = 0.139). This finding warrants close monitoring given the last-resort status of this agent.
The increasing resistance rates to ceftazidime, meropenem, and piperacillin-tazobactam in P. aeruginosa (Table 1), along with the rising isolation rates of resistant P. aeruginosa in both bloodstream and non-bloodstream cultures (Table 2), may suggest a clonal expansion. A recent study from our institution identified bronchoscopy and mechanical ventilation as risk factors for multidrug-resistant P. aeruginosa isolation (22). Non-compliance with infection control measures during invasive procedures, as well as contaminated sinks and antiseptics, are known to cause P. aeruginosa outbreaks (23–25).
We observed an increase in the 3GC resistance rate in E. coli and in the isolation rate of 3GC-resistant E. coli (Tables 1 and 2). Since January 1, 2016, contact precautions were discontinued for patients infected or colonized with extended-spectrum beta-lactamase (ESBL)-producing E. coli (ESBL-EC) in our hospital. However, specific precautions remain for vulnerable populations, such as not admitting neutropenic patients to rooms with patients with ESBL-EC. Medical devices used for neutropenic patients are either single-use or disinfected before use (26). The similar trends observed in bloodstream and non-bloodstream cultures may suggest that ESBL-associated resistance is not restricted to a specific infection site. However, including recurrent admissions of the same patients with ESBL-EC history can be a limitation. A multicenter study reported that single-room contact precautions had no significant impact on hospital-acquired or patient-to-patient transmission of ESBL-EC, even in hematology-oncology settings (27). The first carbapenem-resistant E. coli isolate at our hospital was reported in 2004 (28); however, meropenem resistance rates and meropenem-resistant E. coli isolation rates have remained low and stable, unlike those of K. pneumoniae. This divergence indicates that carbapenem resistance has not established the same foothold in E. coli as in K. pneumoniae, potentially reflecting differences in genetic backgrounds, plasmid transfer efficiency, or exposure to selective pressure.
When interpreting our findings, a major limitation is the retrospective nature of this study. The dataset lacks several critical variables known to influence resistance trends, including quantitative data on patient load during the COVID-19 pandemic and the Kahramanmaraş earthquakes, nurse-to-patient ratios, audit results regarding cleaning adequacy, and adherence to isolation protocols. Because these potential confounders were not systematically recorded throughout the study period, directly attributing the observed shifts in resistance rates to specific interventions is not possible and carries a significant risk of ecological fallacy. Limited molecular epidemiology data, which precluded differentiation between clonal dissemination and gene transfer, and the absence of patient-level data are additional important limitations. Accordingly, the explanatory interpretations presented in this Discussion should not be considered evidence of causality but rather hypotheses informed by the available center-level observations, including Infection Control Committee reports and internal audit results. These observations highlight the multifactorial nature of antimicrobial resistance and may help generate hypotheses for future prospective studies.
An additional limitation is the change in susceptibility testing standards across the study period, including the sequential use of CLSI and EUCAST breakpoints and subsequent EUCAST updates. Because these revisions altered the MIC thresholds used to define resistance, observed temporal variation, particularly abrupt changes coinciding with breakpoint updates, may reflect analytical artifacts rather than true epidemiological events. The absence of raw MIC data prevented retrospective harmonization of all results to a single standard; therefore, resistance trends should be interpreted with this limitation in mind.
In conclusion, antimicrobial resistance remains a growing challenge among hospitalized patients at a university hospital with an infection prevention and control program established nearly four decades ago. Evaluation of two different surveillance indicators confirmed that resistance rates and resistant organism isolation rates are not interchangeable but rather complementary measures. By characterizing pathogens by both resistance and isolation dynamics, hospitals can move beyond conventional surveillance toward more targeted, data-driven responses. Resistance rates can provide important information for optimizing empirical antimicrobial therapy and supporting antimicrobial stewardship programs, whereas resistant organism isolation rates per 1000 patient-days may better reflect changes relevant to infection prevention and control activities.