Introduction
Human adenovirus (HAdV) is a non-enveloped, double-stranded DNA virus that causes self-limiting respiratory system infections, gastrointestinal tract infections, conjunctivitis, and meningitis. These infections are generally observed throughout the year with no seasonal distribution. Despite being self-limiting, HAdV infections are among the most common infections, especially in children, individuals living in communal places (such as schools, military facilities, etc.), and immunocompromised individuals. In these communities, HAdV infections are associated with high morbidity and mortality rates.
Transmission can occur through inhalation of aerosols, direct conjunctival inoculation, the fecal-oral route, or direct contact with infected blood or tissue (1, 2). Although the infection is often asymptomatic, it can lead to complications such as colitis, pneumonia, hepatitis, nephritis, hemorrhagic cystitis, conjunctivitis, encephalitis, or multiple organ failure. In children, HAdV can establish latent infections in various organs and tissues after primary infection and may reactivate, particularly in immunosuppressive therapy (2, 3). The incidence of infection is 3-15% in adults, while it is 6-42%, particularly in immunosuppressive pediatric individuals (4). Among these pediatric individuals, mortality rates reach up to 82% (5).
Since its invention, polymerase chain reaction (PCR) has played a crucial role in molecular disease diagnosis, pathogen identification, and oncogene detection. Over the past 30 years, PCR techniques have undergone significant advancements, becoming more sensitive and capable of simultaneous detection of multiple targets. The widely used method for detecting HAdV DNA is real-time PCR (qPCR). In the qPCR method, fluorescent dyes or probe systems that emit fluorescence upon binding to double-stranded DNA molecules are used, and these emissions are monitored at the end of each cycle. A standard curve is generated based on the intensity of the bound fluorescent dye, and the presence and intensity of viral nucleic acid are determined by identifying a cycle threshold (Ct) value using these standard curves. However, a standard curve requirement of qPCR may cause variation between laboratories and laboratory technicians conducting the test. Additionally, absolute quantitative results cannot be obtained, which causes limitations regarding standardization, accuracy, and repeatability in the identification of adenovirus DNA using qPCR. Furthermore, the qPCR method requires experienced personnel, optimization and validation with standard references. This circumstance leads to variations in laboratory results (6, 7).
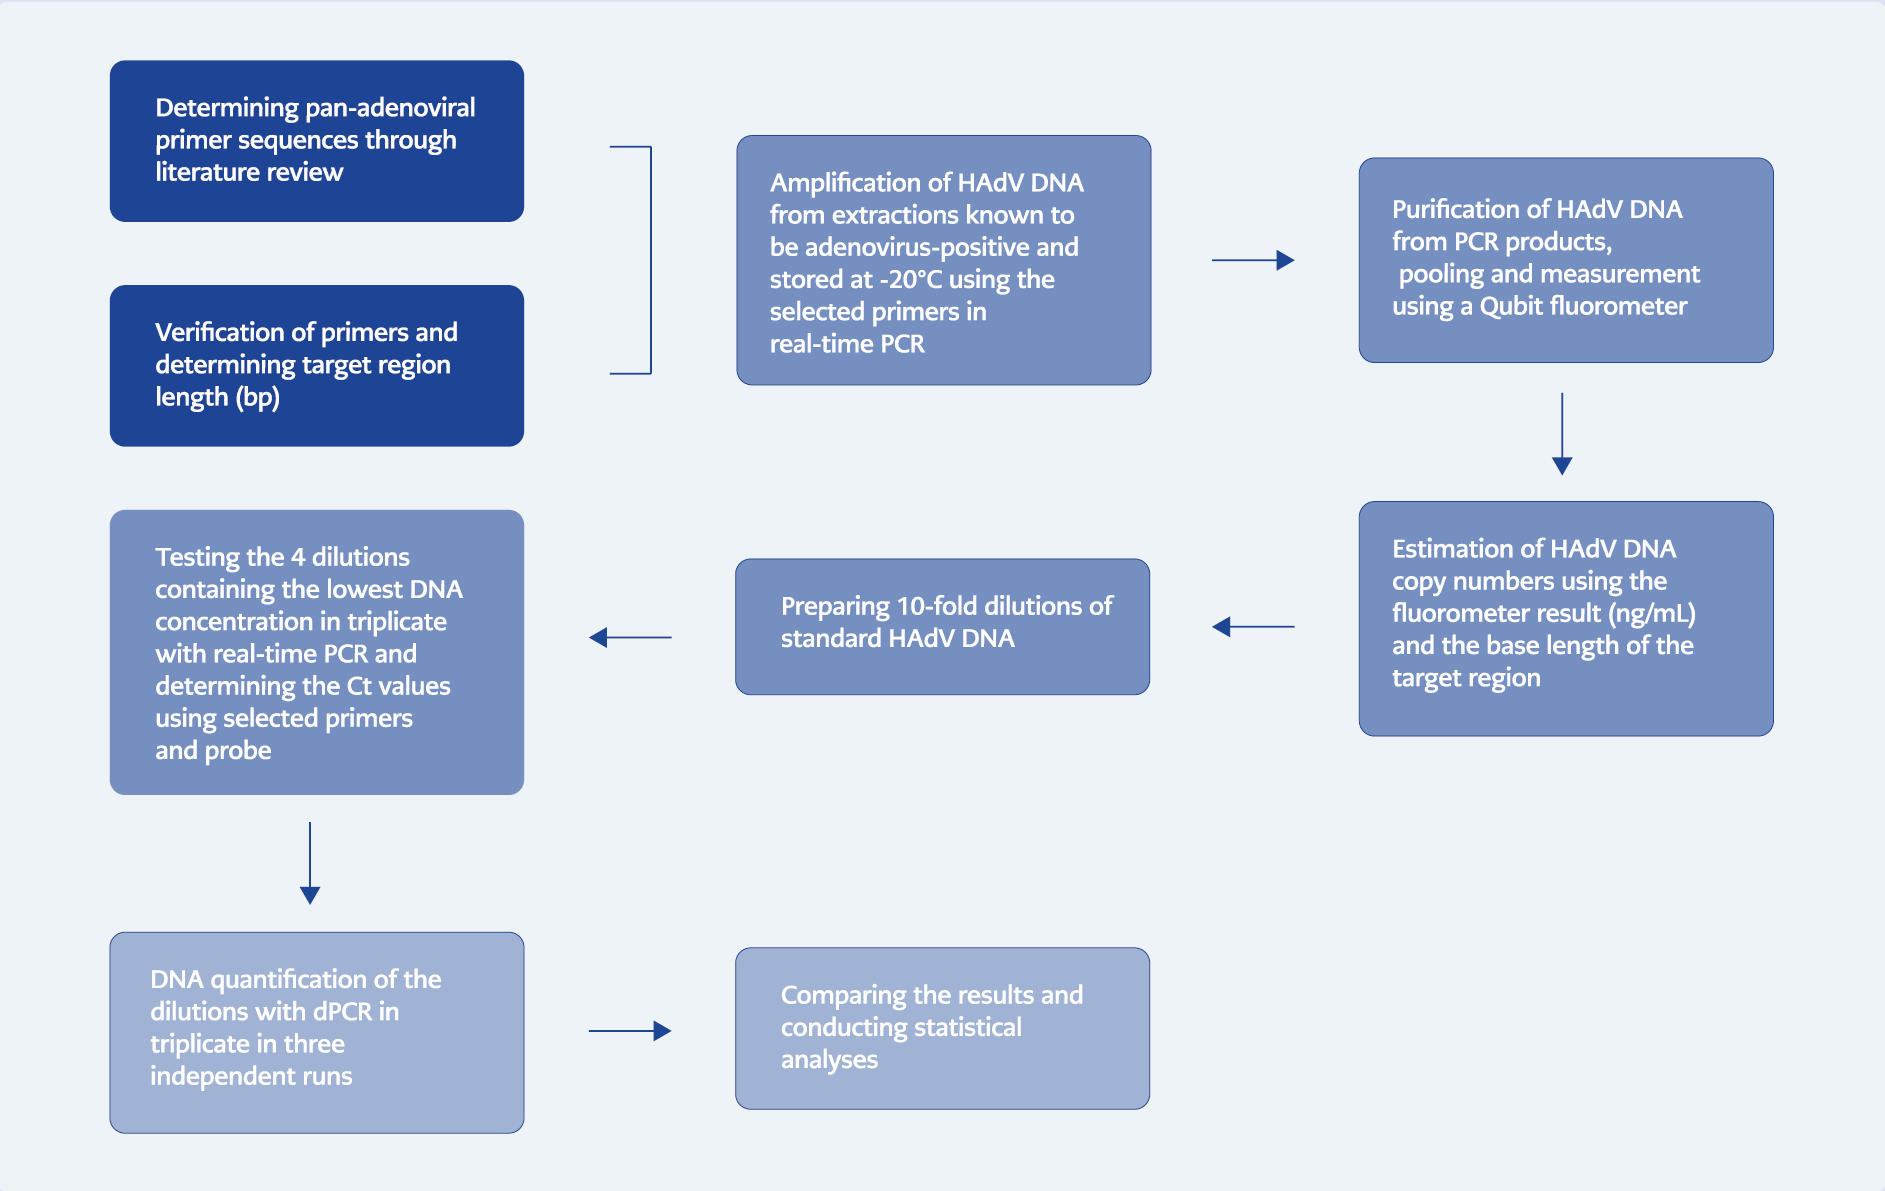
Experimental workflow overview
Among the cutting-edge PCR technologies is digital PCR (dPCR), which enables the absolute quantification of various pathogens. DNA templates are partitioned into individual nanoliter volumes using oil droplets or microchannels in this method. DNA templates are diluted to known concentrations during the first step of amplification, ensuring that each reaction chamber contains 0-3 DNA templates. By conducting the amplification reaction within these partitions, even low target loads can be quantitatively detected, enhancing the assay’s sensitivity. Amplification products are detected in each partition using fluorescent probes or dyes. Consequently, a positive reaction only occurs in partitions containing the target DNA, and the number of compartments with a positive signal allows for absolute quantification without cross-reactions (8, 9). Compared to qPCR, there is no need for a standard curve in dPCR, and it provides absolute quantitative results, which makes this method advantageous over other PCR methods. The literature published so far has reported that dPCR is more sensitive than other PCR methods and has higher analytical sensitivity, especially in cases where the target quantity is low. Additionally, it has been reported that dPCR is capable of identifying various pathogens or different subtypes of a single pathogen in a single session (6, 10, 11).
The current recommendations for adenovirus screening and monitoring for preventive treatment in patients at high risk for HAdV infection are still relatively varied, and more research is needed to provide reliable data that allows for the establishment of standardized approaches. One of the most important conditions for successful antiviral treatment is making a diagnosis as quickly as possible with optimized diagnostic methods and starting antiviral treatment in a timely manner (12). Pediatric allogeneic hematopoietic stem cell transplantation (allo-HSCT) recipients represent one of the most vulnerable patient groups to infections due to severely impaired immune system functions. In line with the European Conference on Infections in Leukemia (ECIL) recommendations, a new monitoring system concept has been developed for these patients. According to this concept, until the immune system is reconstituted, sensitive PCR techniques should be used to screen for HAdV in peripheral blood and stool samples at least once a week (12, 13). Monitoring adenovirus with sensitive, quantitative PCR techniques ensures the earliest possible initiation of priority interventions, such as antiviral therapy, the cornerstone for early detection of viral recurrence and prevention of adenovirus-related morbidity and mortality (14). With sensitive PCR methods, adenoviremia can be detected during the period when T lymphocytes are beginning to reconstitute, especially in cases where the viral load is low (less than 1000 HAdV copies/ml in the blood). This allows for the prevention of disseminated disease development due to HAdV, particularly as a result of immunosuppression, and ensures controlled continuation of treatment (12).
To date, studies have been conducted using the dPCR method for adenovirus quantification in both transplant recipients under immunosuppression and in samples isolated from the environment, and these studies continue to attract attention due to their advantages. Although droplet-based dPCR (ddPCR) technologies appear to be more widely used in these studies, nanoplate-based systems are emerging as more practical and advantageous systems since they do not require additional instruments and additional steps. They are gaining importance day by day (11, 15, 16). Furthermore, the approach to partitioning the total reaction volume differs between nanoplate-based dPCR and ddPCR systems. The plate used in nanoplate-based dPCR systems allows for even distribution of the reaction mixture in equal volumes. In addition, when nanoplate-based PCR systems are compared to ddPCR systems, the partitioning process in nanoplate-based dPCR systems is conducted within a closed system, minimizing the risk of contamination (17).
While clinical studies have been conducted for the quantitative diagnosis of adenovirus using dPCR, most of these studies have been performed with droplet-based dPCR systems and adequate laboratory optimization with standard samples has not been carried out. Correspondingly, we developed a highly sensitive test format based on the dPCR method that can quantitatively detect all types of human adenovirus, even at low copy numbers. This study aimed to demonstrate the development of an in-house dPCR assay and lay the groundwork for sensitive, quantitative detection of human adenovirus, paving the way for future studies, especially in order to monitor and follow-up of HAdV reactivation related to immunosuppressive therapy.
Materials and Methods
Standardization of HAdV DNA
The adenovirus DNA hexon gene region used in this study was prepared in our laboratory by amplifying from the stored extraction products of nasopharyngeal swab samples, which previously tested positive for adenovirus using the QIAstat-Dx Multiplex Real-Time PCR device (Qiagen, Hilden, Germany). We selected the primer and probe sequences through a literature review to ensure their ability to detect all HAdV serotypes in a single run. Pan-adenoviral primers (Sentromer DNA Technologies, İstanbul, Türkiye), HAdV Forward: 5’-CAGGACGCYTCGGAGTACCTGA-3’, HAdV Reverse I: 5’-CGGTGGTCACATCGTGGGT-3’, HAdV Reverse II: 5’-GCTGAAGTACGTVTCGGTGGC-3’, HAdV Reverse III: 5’-GGTGAAGTAGGTGTCCGTGGC-3’, previously described by Yadana et al., were used to amplify the HAdV DNA hexon gene region using qPCR, as well as for following qPCR and dPCR assays. To ensure fluorescent signals in the PCR assays, a FAM-labeled FAM-TGGTGCAGTTYGCCCG-BHQ1 probe was used, as described in the same literature (18). The chosen primers were verified using the US National Center for Biotechnology Information (NBCI) nBLAST tools, and the target sequence was determined using BioEdit software. After amplifying HAdV DNA from the extraction products using real-time PCR, the amplified DNA regions were purified using magnetic beads (Kapa Biosystems, Roche, USA) and pooled. The DNA concentration of the pooled elution was determined using an Invitrogen Qubit Fluorometer 4 (Thermo Fisher, Waltham, MA, USA), following the manufacturer’s instructions (data not shown), and the DNA amount was found to be 57.73 ng/mL. The pooled elution was stored at a temperature of -20 °C, used as a master stock, and diluted before PCR tests.
Preparing Dilutions with Known HAdV DNA Number
The sequence of the hexon region was determined using BioEdit software, and its length was 69 base-pair (bp). The estimated copy number for real-time PCR of the stock solution per milliliter was calculated as 7.634×10¹¹ copies/mL, based on the length of the amplified base sequence and fluorometer measurement using the formula given below (http://www.scienceprimer.com/copy-number-calculator-for-realtime-pcr):
number of copies = amount * 6.022×10²³ / length * 1×109 * 660
Ten consecutive tenfold dilutions were prepared by diluting the master stock, and among these ten dilutions, the last four dilutions were selected. These dilutions contained an estimated 76.34 copies/μl (dilution 1, D1), 7.634 copies/μl (dilution 2, D2), 0.7634 copies/μl (dilution 3, D3), and 0.07634 copies/μl (dilution 4, D4) of HAdV DNA. The estimated copy numbers were calculated once before dPCR experiments, and dilutions were prepared based on the initial measurement. The dPCR system has an upper detection limit of 10,000 copies/μl. Therefore, it is certain that dPCR can detect dilutions containing higher copy numbers. The aim of this study was to validate a suitable platform for the quantitative detection of low DNA copy loads. Therefore, we deemed it appropriate to select dilutions containing lower copy numbers in terms of cost-effectiveness; dilutions containing higher DNA concentrations were not included in the study.
Reaction Components, Setup and Optimization
For dPCR tests, the fully automated nanoplate-based system, which integrates partitioning, thermocycling, and imaging, was the QIAcuity One dPCR System (Qiagen, Hilden, Germany). The Rotor-Gene Q System (Qiagen, Hilden, Germany) was used for qPCR tests. The dPCR 24-well nanoplates with a partition capacity of 26,000 partitions were used for dPCR tests. DNA templates were distributed into wells in random numbers ranging from 1 to 3. Therefore, Poisson distribution was used to calculate the target DNA count quantitatively. For this purpose, the average target DNA count present in each nano-partition’s content was calculated by multiplying it with the total number of partitions. Accordingly, the amount of target DNA per partition (λ) in a binomial distribution was determined by counting the partitions giving negative signals and taking into account the volume of all partitions filled with the reaction mixture. After calculating lambda, the sample concentration containing DNA within each partition volume (C) was determined (19). At the end of the analysis, raw fluorescence images, heatmaps specific to concentrations or partitions, histograms, 1D or 2D distribution plots, scatterplots, concentration diagrams, and quantitative results were automatically generated by QIAcuity Software Suite 1.2.18 (Qiagen, Hilden, Germany). The 4x QIAcuity Probe Mastermix (Qiagen, Hilden, Germany) in the reaction mixture has been optimized for microfluidic dPCR systems by the manufacturer, and it was purchased and used in the reaction mixture in accordance with the ratios recommended in the manufacturer’s test optimization guidelines (20).
In both dPCR and real-time PCR tests, the reaction mixture was prepared in accordance with the dPCR optimizing protocol of the manufacturer; the dPCR protocol was directly customized to real-time PCR. For each primer, the final concentration was 0.96 μM, and for each probe, the final concentration was 0.48 μM. In real-time PCR, 1 microliter of primer-probe mixture and 5 microliters of target DNA were used in a final volume of 12 microliters (8.5 k-24 well nanoplate protocol). For dPCR, 4 microliters of primer-probe mixture and 16.7 microliters of target DNA were used in a final volume of 40 microliters (26 k-24 well nanoplate protocol). The 4x QIAcuity Probe Mastermix was used at a ratio of 1:3 in real-time PCR and dPCR. All PCR tests were performed under the same conditions; only standardized HAdV DNA was used, the same reaction mixture, and the same temperature profile for optimization and validation. Due to material constraints, dPCR tests could not be tested with different annealing temperature profiles, so all tests were conducted at the same annealing temperature, which resulted in inadequate optimization of the test.
Performing Real-time PCR and Digital PCR Tests
Before conducting the dPCR tests, the dilutions were first tested in a single session as triplicates using real-time PCR to evaluate the performance of the primers and probe and determine the Ct values of each dilution. In order to develop an in-house diagnostic test in a laboratory, it is necessary to follow validation and verification rules. To achieve this, several parameters such as dynamic range, limit of detection (LoD), sensitivity, limit of quantification (LoQ), precision, and repeatability need to be determined (21-24). In order to determine these parameters, four consecutive tenfold dilutions containing an estimated 76.34 copies/μl, 7.634 copies/μl, 0.7634 copies/μl, and 0.07634 copies/μl of HAdV DNA were selected (positive, low positive, negative) and they were tested in three independent runs as triplicates under the same conditions using dPCR. Both dPCR and real-time PCR tests were performed using the same temperature profile and cycling protocol, which consisted of an initial denaturation step at 95 °C for 2 minutes, followed by 45 cycles of 15 seconds at 95 °C and 30 seconds at 60 °C, and a final cooling step at 4 °C. The frozen dilutions were thawed before each run.
Statistical Analysis
The dynamic range, mean, standard deviation, and coefficient of variation values of intra-assay and inter-assay data were statistically calculated using the GraphPed v9.2.0. software (GraphPad Software Inc., Boston, USA). Microsoft Excel program (Microsoft Corp., USA) was used for regression analysis.
Results
Determination of Ct Values
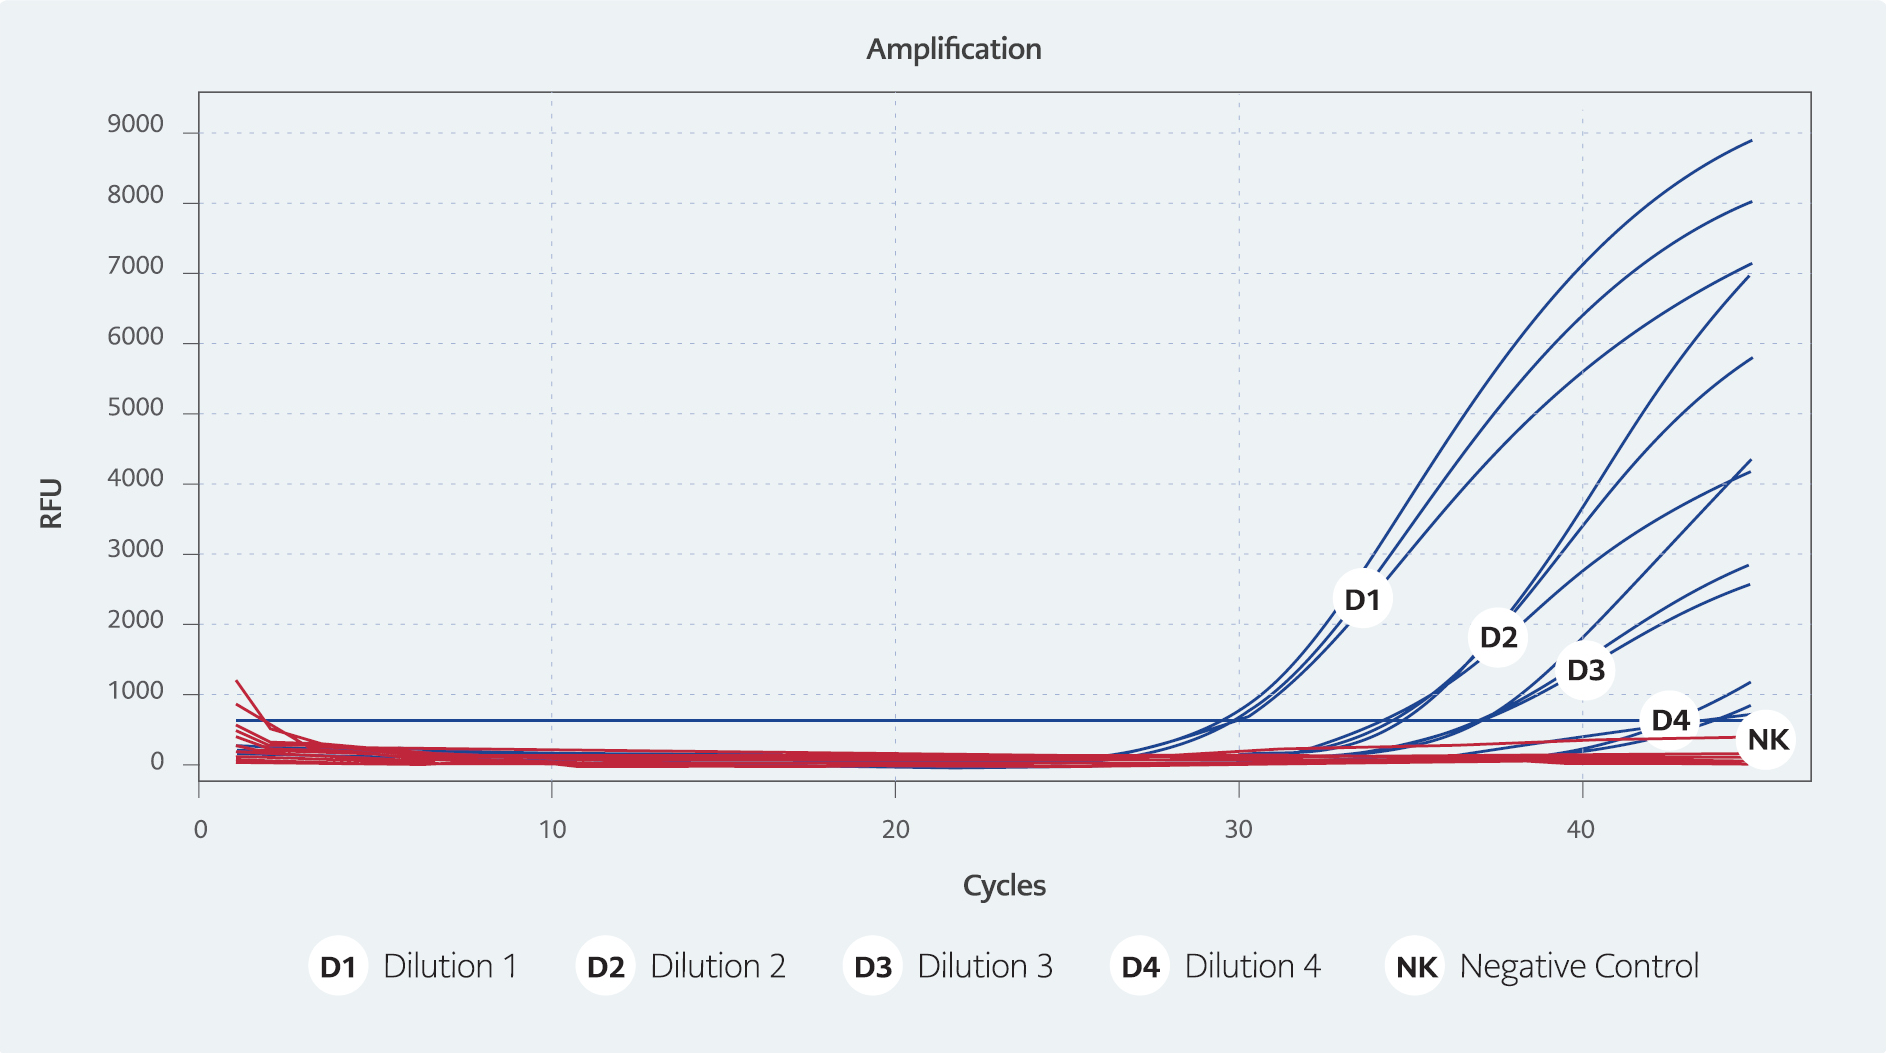
Figure 1. Real-time PCR test results
(D1/76.34 cp/μ, Ct 31. D2/7.634 cp/μl, Ct 35. D3/0.7634 cp/μl, Ct 37. D4/0.07634 cp/μl: Ct 43)
The Ct values of the dilutions containing an estimated 76.34 copies/μl, 7.634 copies/μl, 0.7634 copies/μl, and 0.07634 copies/μl of HAdV DNA were worked on in triplicate on three different days, and were determined to have averages of 31, 35, 37, and 43, respectively (Figure 1).
Analyzing and Evaluation of dPCR Tests
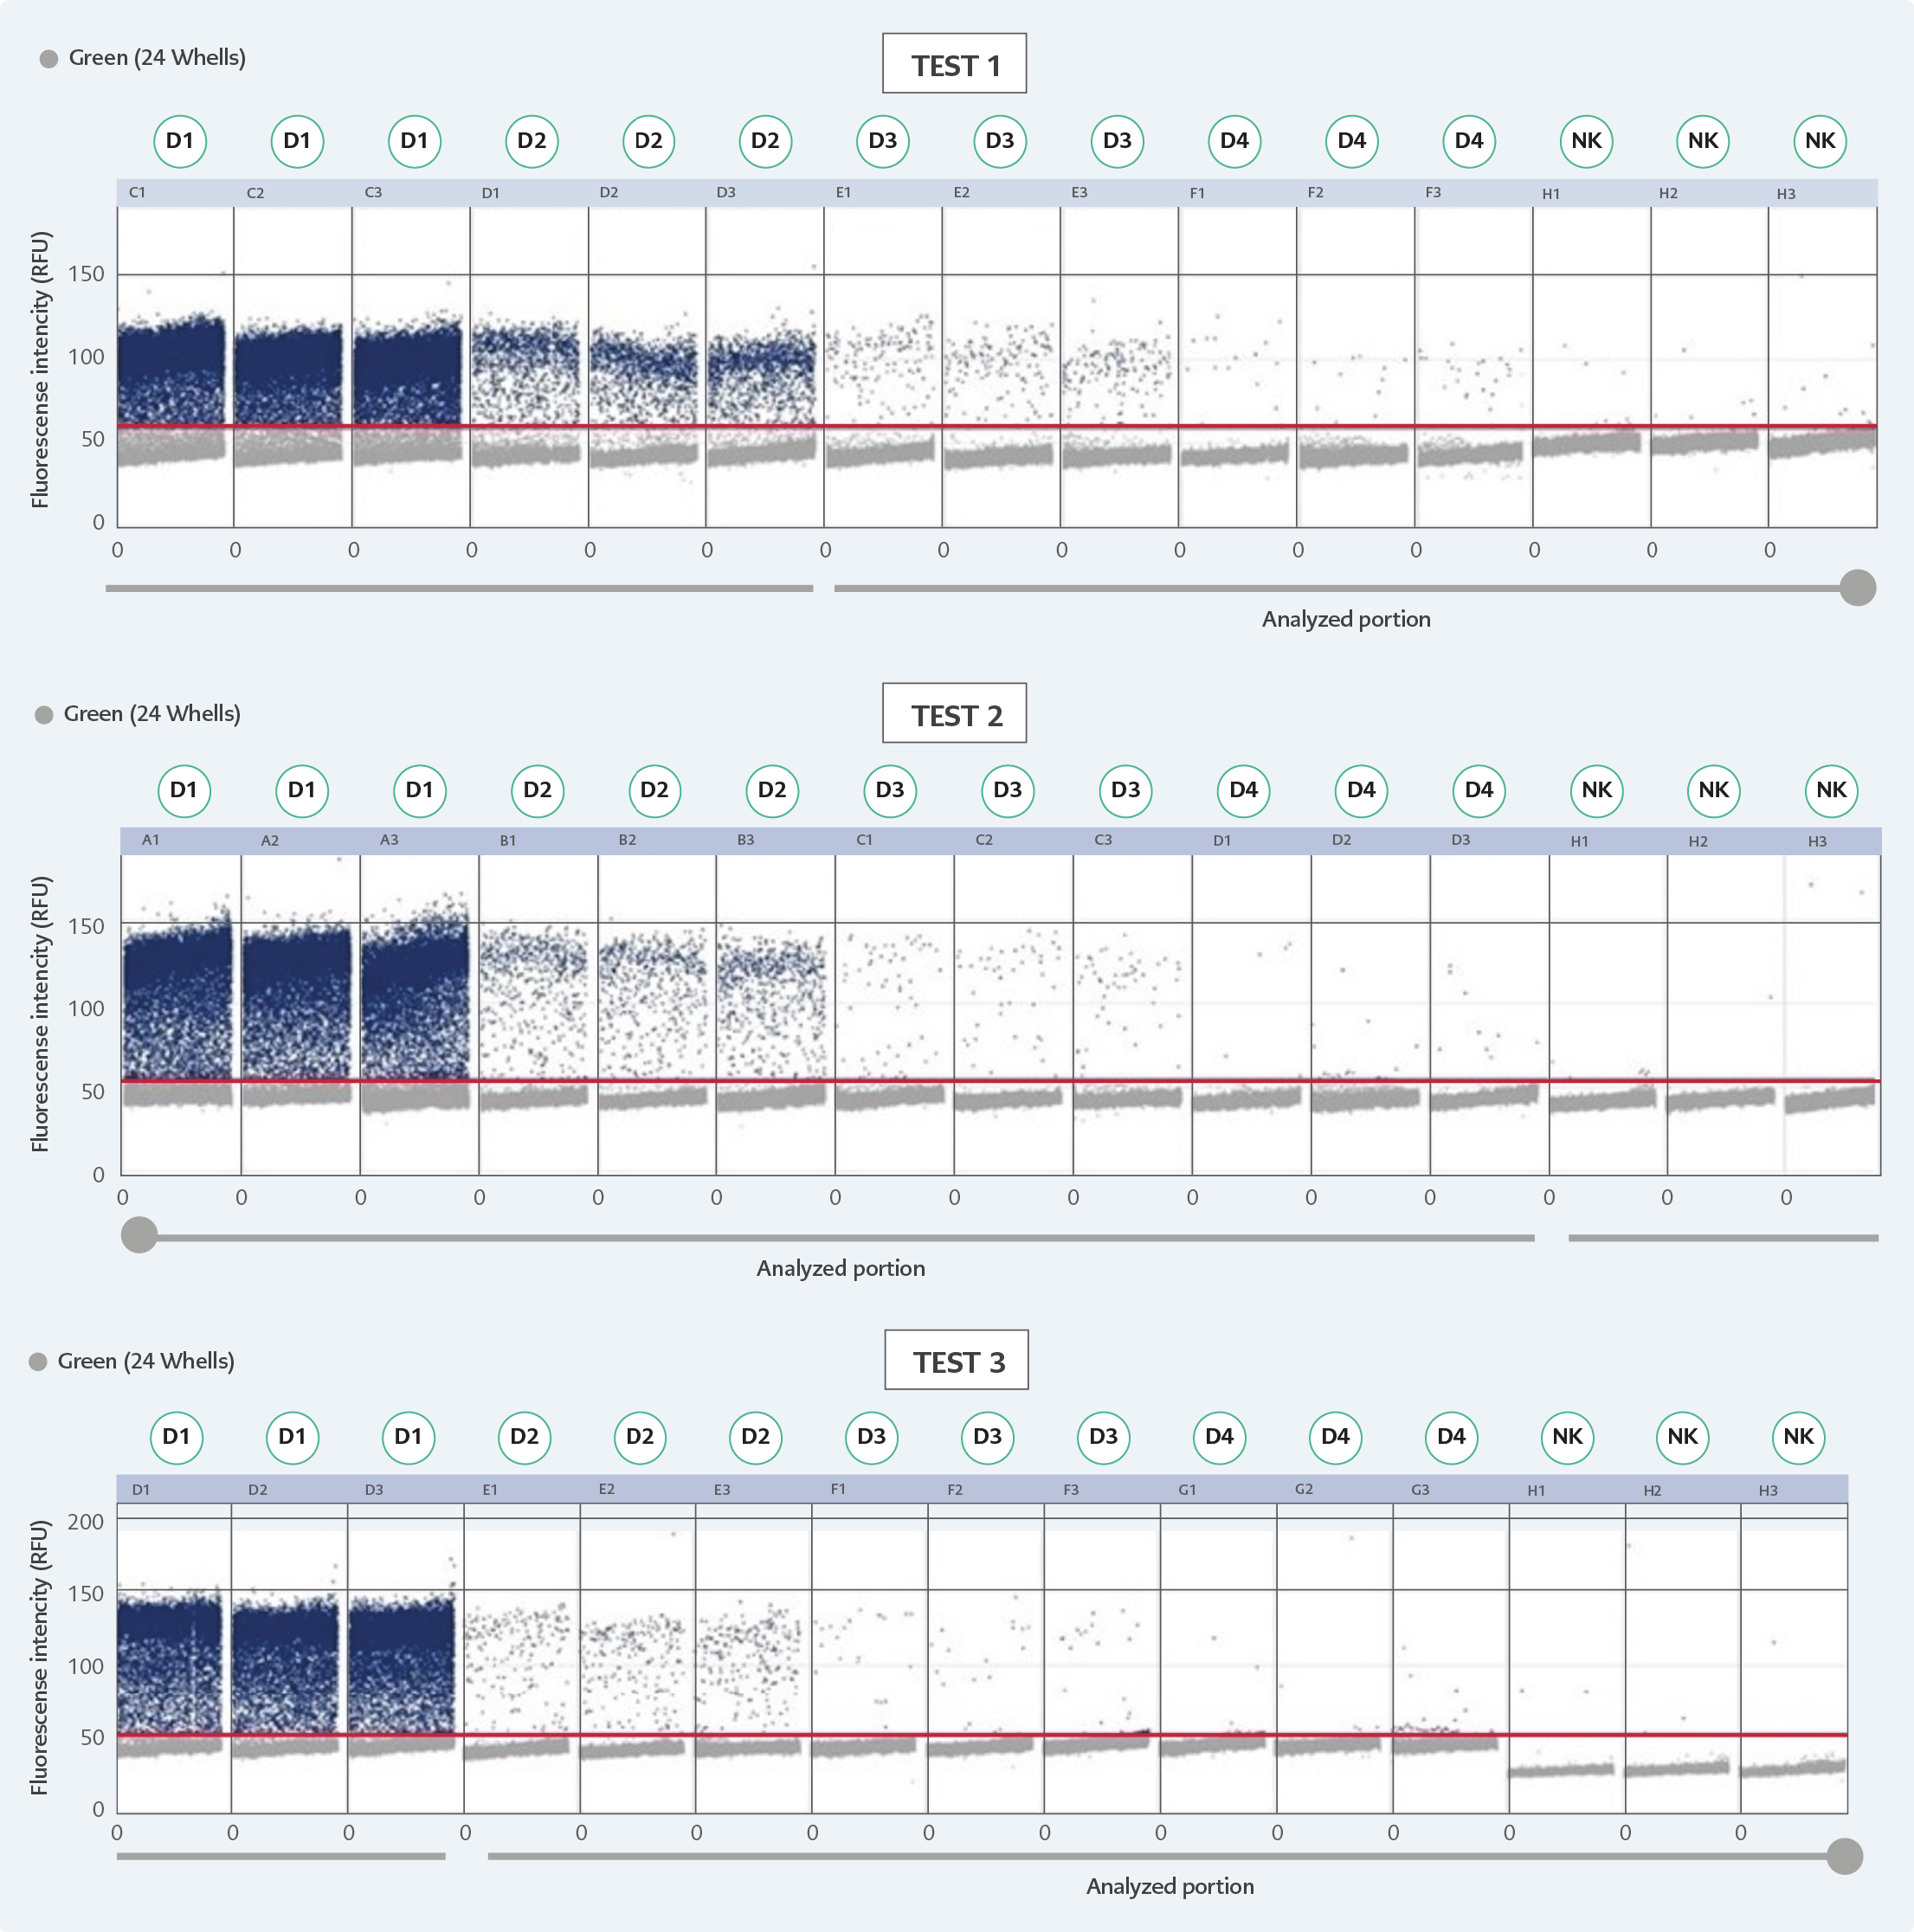
Figure 2. D scatterplots of three independent dPCR assays.
*Estimated copy numbers: D1: 76.34 cp/μl, D2: 7.634 cp/μl, D3: 0.7634 cp/μl, D4: 0.07634 cp/μl.
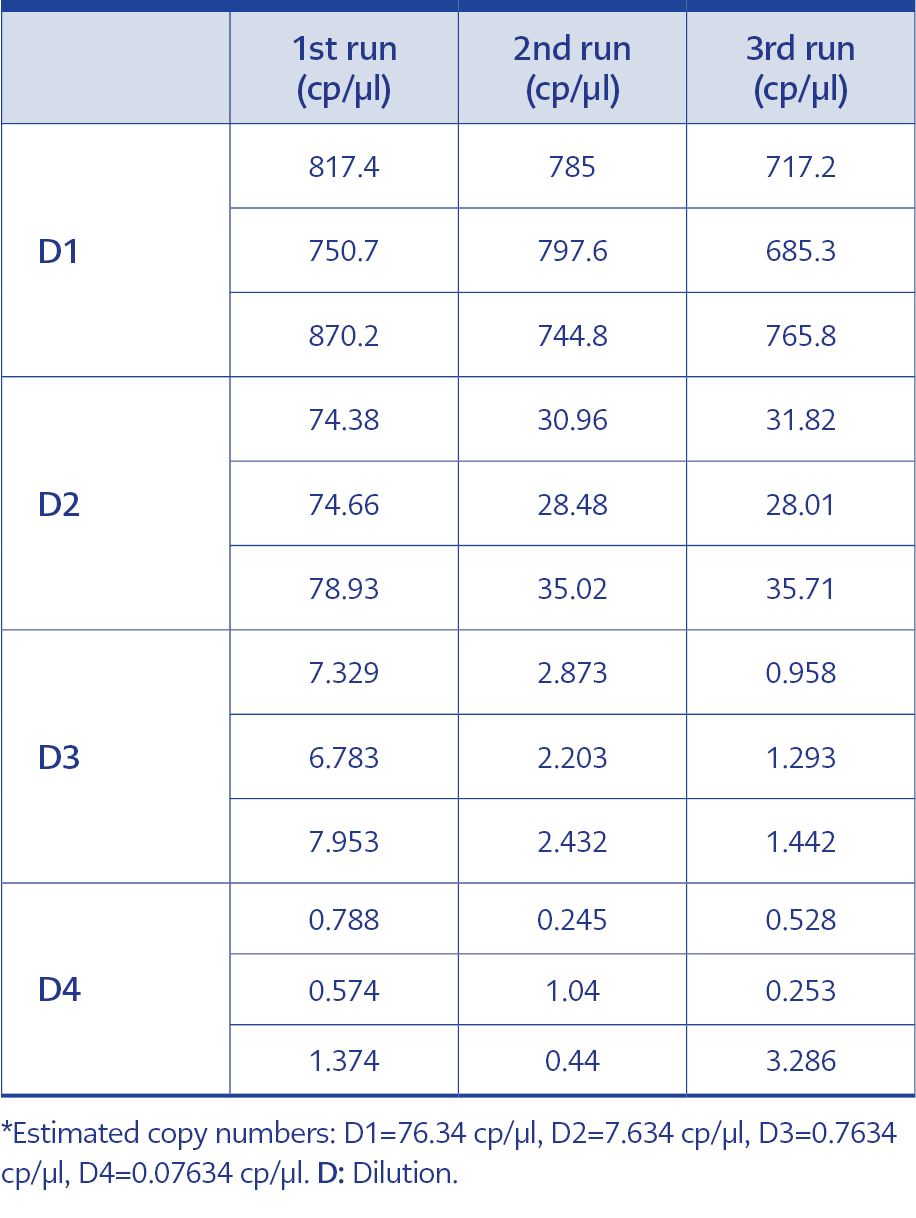
Table 1. dPCR test results for each dilution.
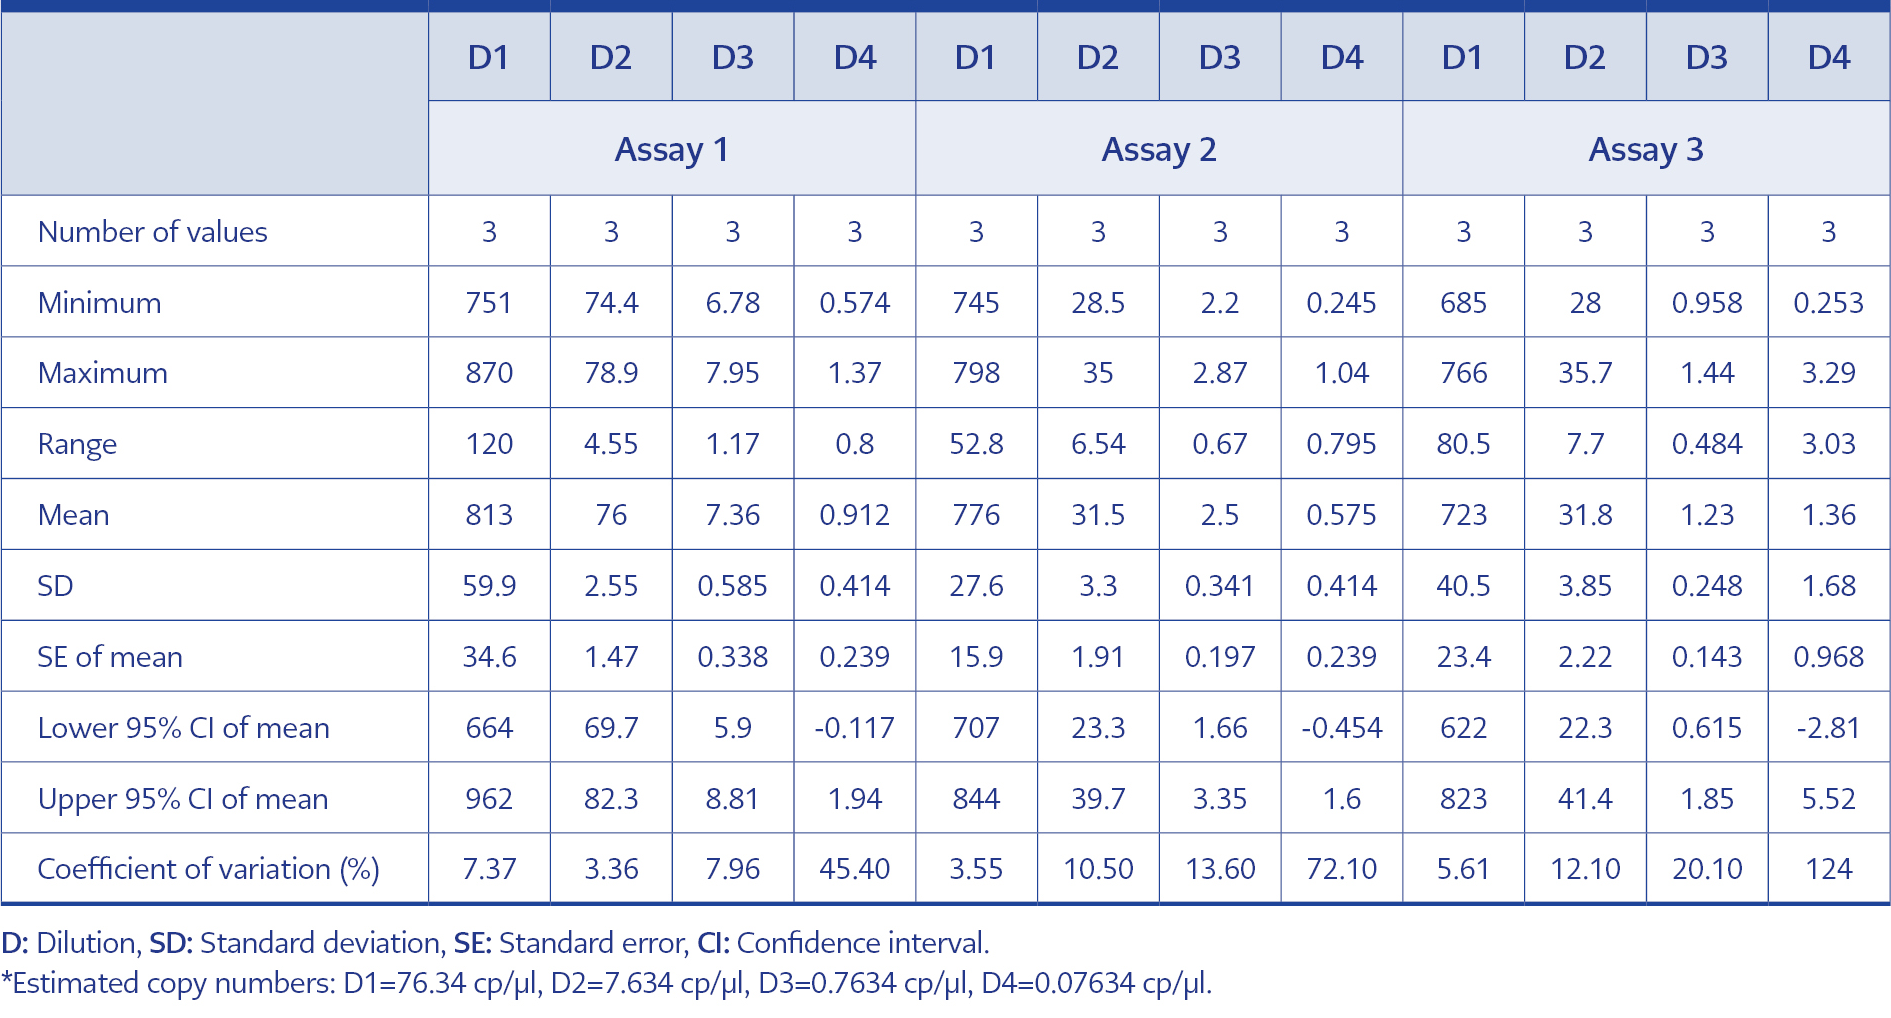
Table 2. Intra-test results of the dPCR tests.
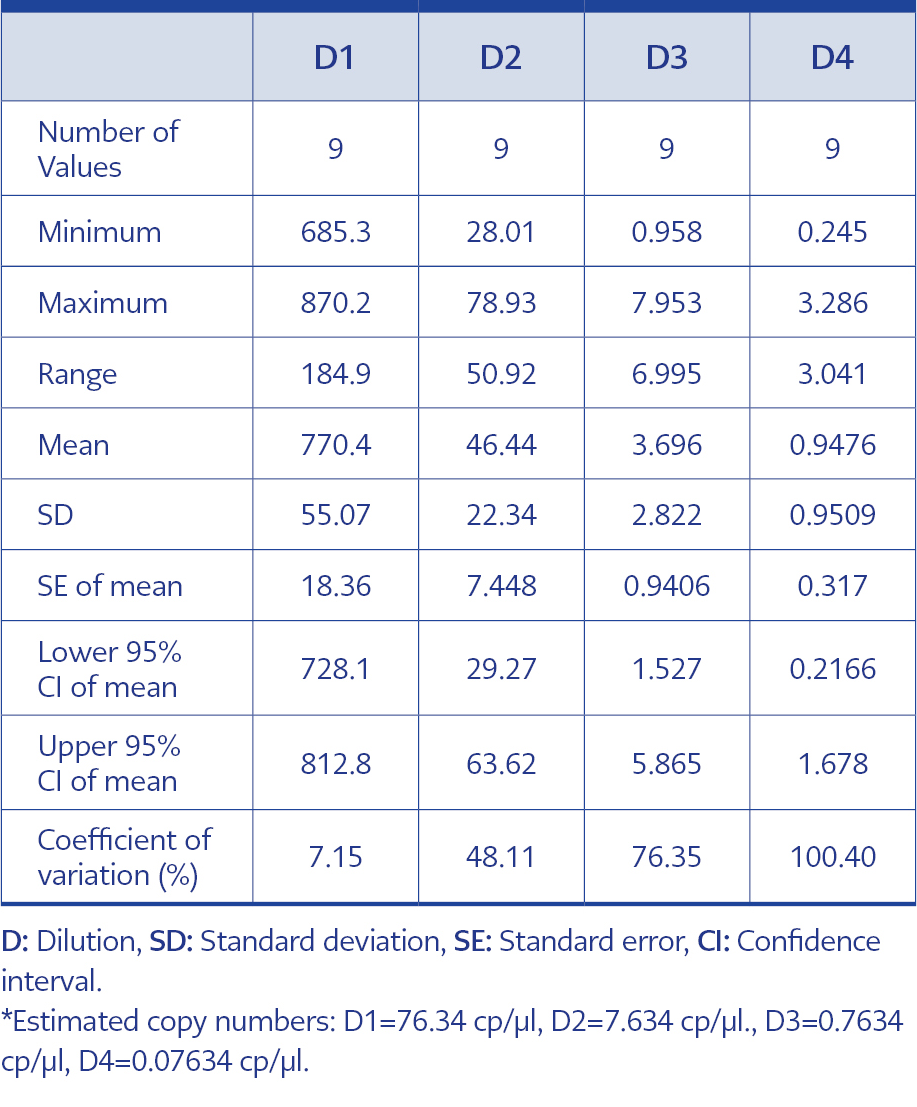
Table 3. Inter-test results of dPCR tests.
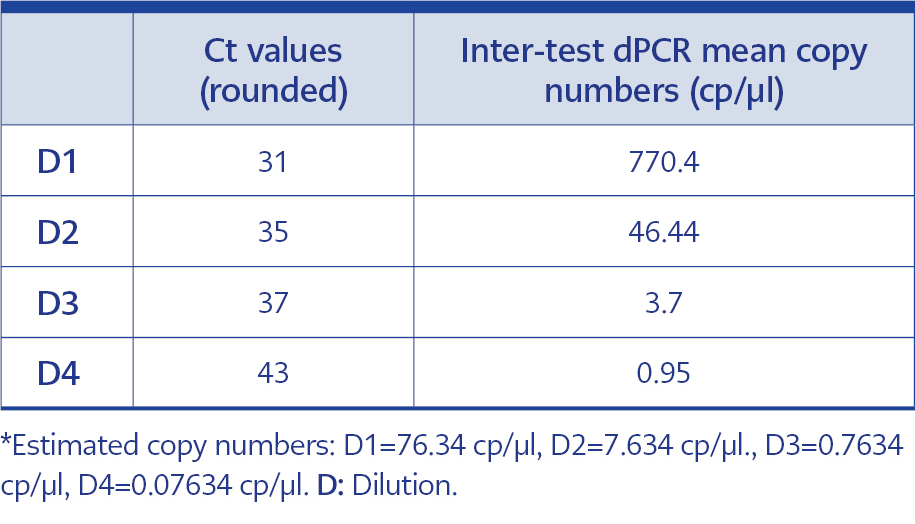
Table 4. Comperhensive values of estimated copy numbers, Ct values and inter-test dPCR results for each dilution.
In order to adhere to validation guidelines, four consecutive dilutions were tested in triplicates across three independent runs. Since ‘rain’ formation occurred in scatterplots, the threshold line was adjusted based on negative control plots and the fluorescence signal results of the partitions to minimize false-negative plots. The scatterplots are shown in Figure 2, and dPCR test results for each dilution and run are presented in Table 1. In Table 2, the intra-test mean values, dynamic ranges, standard deviation, standard error of the mean, upper and lower confidence intervals, and coefficients of variation are provided for each test. The inter-test results are displayed in Table 3. In the dilution containing the highest DNA concentration to the lowest, the inter-test coefficient of variation (CV) values were calculated as 7.15%, 48.11%, 76.35%, and 100.40%, respectively. The estimated copy numbers for real-time PCR, Ct values, and dPCR results are presented comprehensively in Table 4.
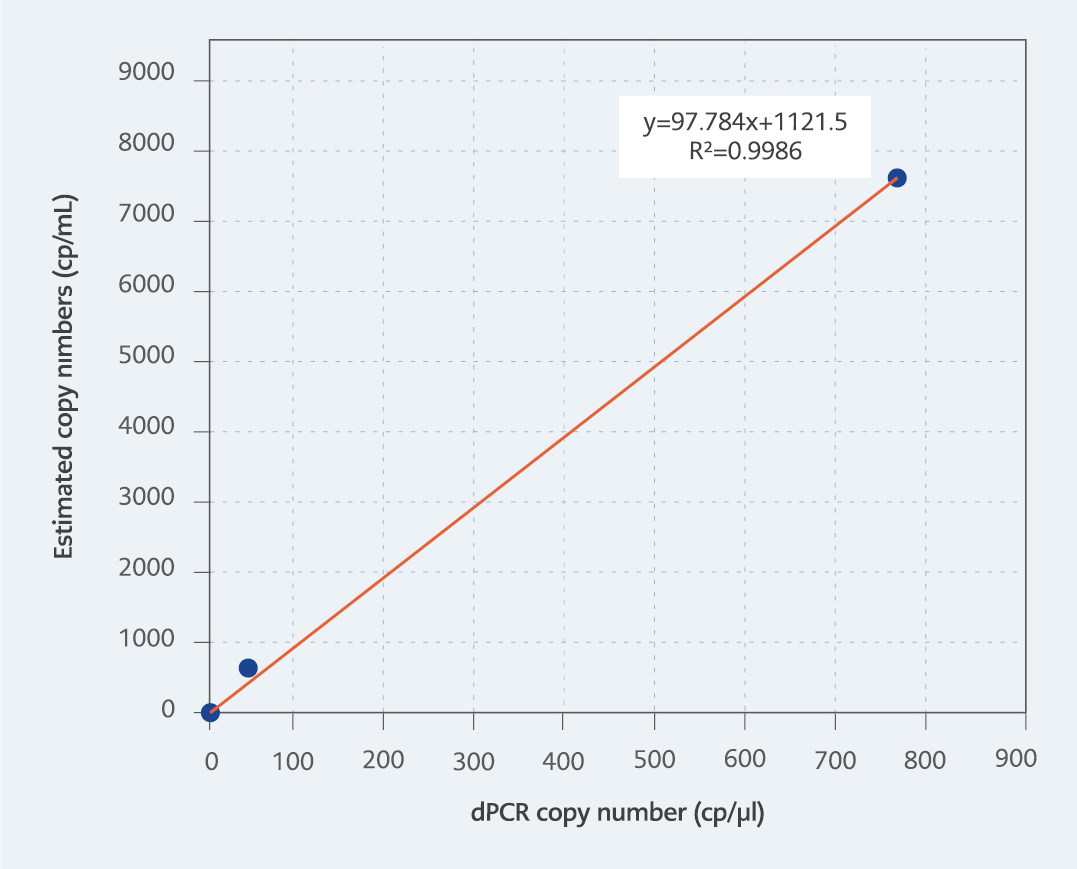
Figure 3: R2 value of the test correlating with estimated copy numbers.
The dynamic range of the test ranged from 770.4 to 0.95 copies/µl, in line with the mean values of three independent triplicate runs. It is important to note that the upper detection limit of the test is 10,000 copies/µl due to the nature of dPCR. We aimed to develop a dPCR-based system capable of detecting all types of adenoviruses at low copy numbers while ensuring cost-effectiveness. Therefore, the dilution containing 76.34 copies/μl HAdV DNA was selected as the first dilution of the test with a high DNA concentration. As a result, the upper limit of the test is 770.4 copies/µl due to this particular circumstance. To determine LoD and LoQ values, the dilution containing the lowest DNA concentration among the four dilutions tested in triplicate in three independent runs was utilized based on the inter-session mean value. Hereby, the LoD and LoQ values were both determined as 0.9476 copies/µl (Table 3). The coefficient of determination (r2) value was calculated to be 0.9986, correlating with the estimated copy numbers (Figure 3).
Discussion
Significant technological advancements have been made in dPCR technology since the publication of the Minimum Information for Publication of Quantitative Digital PCR Experiments (dMIQE) guidelines. dPCR has transitioned from being a technology used in a few laboratories for expensive and limited applications to having an expanded application capacity due to its unique advantages compared to other PCR techniques (19). dPCR provides more sensitive and accurate results than qPCR due to its ability to partition the sample into nano-sized partitions, allowing for individual amplification in each partition and providing quantitative results even at low DNA copy numbers (8, 9, 11). Considering the given information, due to the absence of any commercially available dPCR kit and application suitable for the absolute quantification of human adenovirus, this study aimed to develop a nanoplate-based dPCR test system for the quantification of adenovirus, specifically to contribute to the quantitative diagnosis and monitoring of adenovirus.
To determine the analytical sensitivity, linearity, dynamic range, and intra-assay and inter-assay repeatability of the developed test, a stock solution containing the target DNA was diluted tenfold and tested in three independent sessions with three replicates each. The DNA concentration in the master stock was measured using the Qubit fluorometer method before the PCR tests. Based on the results obtained within the selected dilution series, we believed that our study had high analytical sensitivity and repeatability. Due to the lower limit of detection of the test being 10 times lower than qPCR, it was considered a more sensitive method, and it could be used as an alternative diagnostic method in diagnosing and monitoring of adenovirus. However, when the target DNA copy number per reaction exceed ≥105, qPCR maintains its dynamic range and linearity, while dPCR leads excessive fluorescence signals at these copy numbers and cannot provide quantitative data (6, 7, 9). Correspondingly, dilutions with a target DNA quantity exceeding 10,000 copies/µl were not included in the study, and the highest concentration was selected as <104 copies/l according to the feasible upper detection limit of the system, ensuring that there were no limitations due to the high saturation, and the test results maintained their linearity.
In some dPCR studies, the lack of clear assignment between negative and positive scatterplots and the presence of a large number of partitions emitting intermediate signals can lead to the challenging occurrence of ‘rain,’ which complicates test optimization. In this study, the cause of ‘rain’ formation can be explained by the selection of pan-adenoviral primer sequences targeting all human adenovirus pathogenic serotypes and the preparation of a pooled standardized DNA region from probable different serotypes known to be HAdV positive (25). Unfortunately, due to budget and material constraints, all tests were conducted at only one annealing temperature and could not be tested at different annealing temperatures. This has resulted in insufficient optimization of the test. To address this issue in the quantification of adenoviruses, it is believed that further optimization tests and experimental comparisons with serotype-specific primer sequences and standardized different DNA controls are necessary. In addition, false-positive signals sporadically can occur. These false-positive partitions cannot be distinguished from true-positive partitions, as reported in many studies (25).
According to the results obtained from previous studies, it has been reported that microfluidic dPCR, ddPCR, and qPCR show equivalent sensitivity at low copy numbers or that dPCR is more sensitive than qPCR (11, 15, 16). In the study of 97 children who underwent HSCT in the post-transplant period, Haruta and colleagues conducted adenoviral viral load monitoring using a droplet-based dPCR system. In this study, while real-time PCR detected HAdV DNA positivity in 2% of all samples, ddPCR detected HAdV DNA positivity in 9% of samples. Additionally, the low coefficient of variation in ddPCR was reported as an indicator of the test’s high repeatability. However, both methods reported a sensitivity of 5 IU/reaction, and the benefit of ddPCR in terms of sensitivity in clinical studies is not clear (11). In this study, the Ct value of the dilution containing 0.07634 copies/μl HAdV DNA was 43 with qPCR, which is above the reliable upper limit.
In comparison, the quantification limit was determined as 0.9476 copies/µl using the dPCR method. While this Ct value obtained falls outside the reliable threshold for the qPCR method, it could be quantified with dPCR with ten times sensitivity. However, repeatability and test sensitivity decreased in the fourth dilution, which had the lowest DNA copy number, and the CV value was 100.40%. The significant increase in CV in this study, especially at Ct values that could be considered negative in real-time PCR, i.e., very low copy numbers, indicates the imprecision of the dPCR method. These initial data underscore the importance of further detailed studies to enhance laboratory and clinical validation. According to the intra-assay and inter-assay results of dilutions with higher DNA concentrations, high repeatability (coefficient of variation, standard deviation) was observed, which was consistent with other studies (11). However, it should be noted that due to the limited dynamic range inherent to dPCR systems (upper detection limit of 105 copies/µl), quantitative data cannot be obtained for DNA copy numbers exceeding the dynamic range.
In studies conducted using conventional PCR, qPCR, and ddPCR by Dong et al., droplet dPCR was reported to be 100 times more sensitive than qPCR and more specific when cross-reactions were controlled. Although dPCR methods are more costly compared to other PCR methods, they offer advantages in biological studies due to their ability to provide absolute quantitative results, high specificity, sensitivity, and repeatability (10). In line with the findings of this study, in our study, for three dilutions (D2, D3, D4) where amplification curves with Ct values >33 were deemed unreliable to be considered positive by real-time PCR, the dPCR method successfully provided quantitative data.
Detecting the presence of various microorganisms in samples isolated from the environment is crucial for monitoring public health, disease epidemiology, and surveillance (15, 16). Various PCR techniques are utilized for diagnostic purposes in such situations that pose a threat to public health. In a study conducted by Kishida and colleagues on the quantification of enteric HAdVs in river waters using nanoplate-based dPCR, they determined the dynamic range of the test as 420-2700 copies/L. In line with these results, they reported that reliable quantification data can be obtained with dPCR even when the target copy number in the reaction mixture is low. They attributed this to the binary output of dPCR, where each nanoliter-volume partition either exhibits a positive or negative PCR reaction, and the quantified copy number is independent of PCR amplification efficiency (15, 16). In our study, which focused on the quantification of human adenovirus using the nanoplate-based dPCR method, the mean value of the highest detection level in triplicate tested dilutions was determined as 770.4 copies/µl, and the mean value of the lowest detection level was 0.9476 copies/µl. These findings demonstrate that the dPCR system can provide quantitative results with high sensitivity.
In our study, which focused on the quantification of human adenovirus using the nanoplate-based dPCR method, the mean value of the highest detection level in triplicate tested dilutions was determined as 770.4 copies/µl, and the mean value of the lowest detection level was 0.9476 copies/µl. Compared with real-time PCR system, it should be noted that these DNA concentrations cannot be reliably detected and quantified with real-time PCR. While some studies have shown that dPCR is a highly sensitive method, it has been reported that this system is not yet suitable for routine diagnosis and requires further development (16). In a laboratory, it is necessary to determine the sensitivity of an in-house quantitative test and perform its validation. There are criteria that must be tested according to ISO 15189 and ISO 17025 for the Accreditation of Medical Laboratories in order to determine these. These criteria require determining the dynamic range, LoD, LoQ, and repeatability of the developed test (21, 22, 26). To determine the dynamic range of the developed test, it is recommended to work with a minimum of five logarithmic concentration ranges, each performed in triplicate (22). According to the operating protocol of the dPCR system used in this study, the dynamic range was reported as 104-100 copies/µl (17, 20). As the starting point of our study, determining the sensitivity of the test at low viral copy numbers was our primary objective. Since current molecular diagnostic methods used in adenovirus diagnosis can detect sensitively down to 1000 copies/ml, working with four consecutive logarithmic dilutions, as previously mentioned, was considered appropriate in terms of both technical and cost aspects to determine the dynamic range of the test. To our knowledge, the present study holds the distinction of being the first validation study conducted to develop a nanoplate-based dPCR assay for the quantification of adenoviruses.
In order to develop a new test method in a laboratory, determining the sensitivity of the method goes beyond establishing the detection limit. The detection limit is generally the lowest target DNA concentration at which the amplified product is qualitatively detected with at least 0.95 probability Determining this concentration is achieved by creating a dilution series of samples consisting of a single component (21, 22). Based on these theoretical findings, a consecutive 4-logarithmic dilution was performed to determine the detection limit, and the average LoD value of the repeated test was determined as 0.9746 copies/µl. The LoQ of the developed test is the lowest amount of analyte that can be reliably measured. To determine this, dilutions containing the analyte at low concentration levels should be repeatedly tested. The quantification limit can be equal to the detection limit but cannot be lower (26, 27). In this study, a consecutive 4-logarithmic dilution was performed in three separate sessions with three replicates each to determine the LoQ value. Dilutions with a Ct value greater than 31 were used for absolute quantification of adenovirus DNA without using clinical samples. The highest Ct value used in our study was 41, and the lower LoQ was determined to be 0.9476 in the dPCR method. However, as there may be differences in LoQ values between our standard and clinical samples, thus, it is important to validate our method with clinical samples in order to make it suitable for field use. Since different matrices and clinical samples were not used in this study, the LoQ and LoD values should equal 0.9746 copies/µl.
In Japan, a nanoplate-based dPCR system was used for the multiplex diagnosis of various waterborne viral pathogens, including adenovirus serotypes 3, 7, and 55, in water samples collected from the environment. According to the results obtained, the LoQ value for adenoviruses was reported as 2 copies/microliter (28). Our study results are in parallel with this research, with a LoQ value determined as 0.9476 copies/microliter. The limitation of our study is that it could not be conducted with different matrices or different clinical samples, so the LoQ value was considered equal to the LoD value. In tests involving different matrices or clinical/environmental samples, the LoQ value should be equal to or greater than the LoD value (26).
The parameters that establish the accuracy of an in-house test are reliability and precision, and precision is further ensured by repeatability and reproducibility. Repeatability refers to testing the same test under the same conditions, in the same laboratory, with the same equipment, and using the same method by a single analyst multiple time. Reproducibility, on the other hand, measures the consistency of results obtained by testing the assay several times by different analysts in different laboratories under different conditions (21, 29, 30). This study was conducted in the İstanbul University-Cerrahpaşa Molecular Microbiology Laboratory using the same equipment and performed by the same analyst. Dilutions were prepared and repeated a total of nine times each. The obtained results demonstrated that the test was highly repeatable. However, in order to determine the reproducibility of the test, it was intended to conduct further stages of the study under different conditions. In addition, the CV values of the developed test increased in repeated tests, and the repeatability of the test decreased in these dilutions. It is believed this was due to the repeated freeze-thaw cycles of the dilutions during ongoing experiments (19).
Linear regression analysis (r2) is a method used to demonstrate the relationship and, if present, the strength of the relationship between the average quantitative values of repeated tests of dilutions with known concentrations. A value close to 1 indicates a high relationship between the variables (26). In this study, dilutions with known target analyte concentrations were used. The concentration of the dilutions was determined by performing measurements with a fluorometer, and a linear regression analysis was conducted by comparing the quantitative results obtained from dPCR testing with the Qubit fluorometer results. Since we estimated and calculated the copy numbers in the dilutions, they did not directly match the quantitative results obtained with dPCR; however, the relationship between the results was determined by the r2 value. The r2 analysis correlating with the estimated copy numbers was determined to be 0.9986, which indicated that the test results were highly consistent.
The method was designed with a limited budget and limited materials because this study is a doctoral thesis. Therefore, we believe that the formation of ‘rain’ occurred due to the inability to perform test optimization with different temperature profiles, as well as the use of pan-adenoviral primer sequences that can detect all adenovirus serotypes in a single run. In addition, since testing could not be done in different laboratory conditions, with different personnel and different matrices, the reproducibility of the test could not be evaluated.
Different dilutions tested in a single run were carried out on a single plate in the nanoplate-based digital PCR system used in the study. There was no separate cover for each well on the plate, and after distributing the dilutions and negative template control (NTC) to the micro-wells, the plate was covered with a single seal at once. We believe that due to the high sensitivity of the dPCR system, micro-wells containing NTC may have given false positive signals due to nucleic acid contamination during the pipetting of positive samples or during the process inside the cabinet.
In all dPCR systems, quantitative results are determined using Poisson distribution, and based on this statistical method, the significantly lower detection limit is considered 1 copy/μl, which is why signals below this limit cannot be evaluated as true positives. The average quantitative result of the positive partitions seen in dilution 4 was close to 1 (0.9476 cp/μl), while the positive signals in the NTC gave results between 0.4-0.0 cp/μl. Due to this difference between low-concentration wells and NTC wells, these signals were insufficient to be considered as positive and were considered as contamination.
The dPCR method stands out as a highly advantageous technique compared to other PCR methods due to its suitability for absolute quantification, its ability to provide more sensitive and reliable results at low copy numbers, and its lower likelihood of obtaining different results among laboratories and users without the need for a standard curve. Based on the results obtained from this study, we believe that the dPCR method could be an easy and effective alternative for monitoring adenoviral load and providing absolute quantification, especially in low copy numbers. In this regard, to make this test suitable for routine field use, it needs to be supported by further in-vitro and clinical studies in subsequent stages. Advanced laboratory optimization and validation studies need to be conducted to overcome limitations in the study, and the results need to be tested with different matrices and clinical samples.