Introduction
Healthcare-associated infections are frequently encountered in intensive care units (ICUs), with more than 30% of all ICU admissions having an infection (1). For decades, antibiotics have provided an effective treatment for infectious diseases (2). Since most antibiotic resistance is caused by misuse or abuse of antibiotics, one of the strategies that could be applied is to ensure optimization of antibiotic dosing regimens (3). Some pharmacokinetic (PK) and pharmacodynamic (PD) indices for antibiotics have been reported in the literature. By achieving these PK-PD targets, the possibility of clinical and microbiological cure in critically ill patients can be increased, and the development of antibiotic resistance can be minimized (4).
Teicoplanin, a glycopeptide antibiotic, is administered to treat infections caused by Gram-positive pathogens (5). Although the target PK-PD parameter for teicoplanin is the area under the concentration-time curve (AUC) divided by the target pathogen’s minimum inhibitory concentration (MIC), AUC estimation software is not available in many institutions. As a result, trough-level monitoring is recommended as a surrogate marker of AUC/MIC in clinical settings (6). For most infections caused by susceptible organisms, a teicoplanin trough level of at least 10 mg/L is recommended for clinical success; however, for severe staphylococcal infections (e.g., endocarditis), trough levels greater than 20 mg/L are recommended (7). Because blood levels of teicoplanin are poorly predictable, therapeutic drug monitoring (TDM) should be planned in patients with severe infections, acute/chronic renal dysfunction, burn infections, hypoalbuminemia, and paediatric populations (5, 8-11). However, it has been reported in the literature that the target level of teicoplanin could not be reached in the majority of patients with conventional dosing (12).
There are numerous studies, two of which were developed for the detection of multiple antibiotics simultaneously, regarding teicoplanin quantification in humans using liquid chromatography-tandem mass spectrometry (LC-MS/MS) method with a total runtime between 5 to 7 mins (13-15). These studies employed numerous internal standards, including polymyxin B sulphate, 10-hydroxycarbazepine, and daptomycin. The linear range of the teicoplanin quantification method was reported as 12.0–89.0 mg/L, 1.75–63.0 mg/L, and 1.0–100.0 mg/L, respectively. In these studies, the developed methods were applied in a patient sample.
This study aimed to develop and validate an LC-MS/MS method to quantify teicoplanin in human plasma and adapt the method to a critically ill patient sample.
Materials and Methods
Study Setting
The study was conducted in the 26-bed capacity anaesthesiology and reanimation ICU of İnönü University Turgut Özal Medical Centre in Malatya, Türkiye, between May 9, 2022, and January 27, 2023. Because of the Kahramanmaraş earthquake on February 6, 2023, the 12-bed capacity anaesthesia ICU of Erciyes University Gevher Nesibe Hospital in Kayseri, Türkiye, was added as a secondary centre to the study. Patient inclusion was continued there between May 1, 2023, and July 21, 2023. Initially, the ethical approval was granted for İnönü University (2022/17, March 2, 2022), but because of the earthquake, Erciyes University Gevher Nesibe Hospital was added as a second centre to the ethical approval later, so another ethical approval was not granted for Erciyes University.
Patient Selection
The inclusion criteria were age over 18 years, hospitalization in the ICU, and receiving intravenous teicoplanin treatment for at least 48 hours due to any infectious disease. The written informed consent to participate in the study was obtained from the patient’s relatives, as the patients were often unconscious or sedated. The exclusion criterion is applied to patients with missing data.
Data Collection
Demographic data, anthropometric data (including body weight [kg], height [cm], and body mass index (BMI) [kg/m2]), admission diagnosis, admission and discharge dates, patient comorbidities, laboratory data, and the Acute Physiology and Chronic Health Evaluation II (APACHE II) (16) score at admission, as well as the Sequential Organ Failure Assessment (SOFA) (17) score on admission day, and on the first, fourth, and last days of the teicoplanin treatment, were obtained from the hospital’s electronic database.
In addition, the patient’s daily fluid balance (mL), daily medication orders, and daily Glasgow Coma Scale (GCS) were collected from the patient file throughout teicoplanin treatment. Estimated creatinine clearance (eCrCl) was calculated using the Cockcroft-Gault equation (18). Admission diagnoses were classified according to the International Classification of Diseases, 10th version (ICD-10) (19).
Thrombocytopenia was defined as a platelet count below 150 x 103/µL, and hepatotoxicity was defined as serum AST or ALT levels exceeding three times the upper limit of normal (ULN) based on the hospital’s reference ranges for each parameter.
Collection of Blood Samples
Because teicoplanin has a long elimination half-life, it reaches steady-state concentration as long as four days. Therefore, blood samples were collected from the patients on the fourth day of the treatment into K3EDTA anticoagulant-containing tubes 30 minutes before the fifth dose was administered, as recommended in the literature (6). The blood samples were centrifuged at 3500 rpm for 10 minutes immediately, and the plasma was divided into 4 to 6 microcentrifuge tubes. The plasma samples were immediately frozen at -80°C and stored until LC-MS/MS analysis.
Preparation of Standards and Plasma Samples
Teicoplanin standard powder (Sigma-Aldrich, St. Louis, USA) was used to prepare 100 mg/mL of teicoplanin standard superstock solution. Using 100 mg/mL of teicoplanin-in distilled water standard superstock solution, 25, 5, and 1 mg/mL of teicoplanin standard stock solutions were prepared by serial dilution with distilled water. To get the standard curve drawn, 100, 50, 25, 12.5, 6.25, 3.13, and 1.56 mg/L of teicoplanin standard solutions were prepared using drug-free plasma from 1 mg/mL standard solution by serial dilution. Vancomycin hydrochloride (Sigma-Aldrich, St. Louis, USA) was used as an internal standard. Using 5 mg/mL of vancomycin-in distilled water internal standard superstock solution, 100 mg/L of vancomycin internal standard stock solution was prepared by serial dilution with distilled water. Drug-free plasma was used as blank sample.
For chromatographic analysis, two mobile phases were used: mobile phase A consisted of 0.1% (v/v) formic acid in the water, and mobile phase B consisted of 0.1% (v/v) formic acid in a 5:1 (v/v) acetonitrile-water mixture. To prevent cross-contamination between samples, a 50% (v/v) methanol-water solution was used as an autosampler washing solution.
Sample Pretreatment
Into the microcentrifuge tubes, 100 μL of teicoplanin standard solutions or plasma samples were taken and then 35 μL of 100 mg/L of vancomycin internal standard solution was added. To precipitate out the proteins, 500 μL of acetonitrile was added to every standard or plasma sample, and the microcentrifuge tubes were vortexed for 1 minute. Then, the tubes were centrifuged at 10,000 rpm for 5 minutes. Into the vials, 100 μL of clear supernatant was taken, and 200 μL of mobile phase A solution was added; after vortexing for 10 seconds, the vials were injected into LC-MS/MS.
LC-MS/MS Analysis
The analysis was conducted at the Erciyes University Drug Research and Application Centre. Shimadzu Nexera XR system equipped with a CC-20AD pump (Shimadzu Corp., Kyoto, Japan), a SIL-20AC autosampler (Shimadzu Corp., Kyoto, Japan), and Raptor® C18 reverse phase column (Restek Corp., Pennsylvania, USA) (2.7 μm, 50.0 x 3.0 mm) was used. LabSolutions LCMS (Shimadzu Corp., Kyoto, Japan) software was used in data collection and analysis. The following column conditions were set: column temperature of 40°C, flow rate of 0.3 mL/min, injection volume of 5 μL, total operation time of 5.5 mins. The mobile phase gradient was programmed as follows:
- 0.0–0.5 min: 5% mobile phase B
- 0.5–1.5 min: linear increase from 5% to 100% B
- 1.5–2.5 min: 100% B
- 2.5–2.6 min: linear decrease from 100% to 5% B
- 2.6–5.0 min: 5% B.
Under these conditions, the retention times for teicoplanin and vancomycin were determined to be 2.320 and 2.002 minutes, respectively.
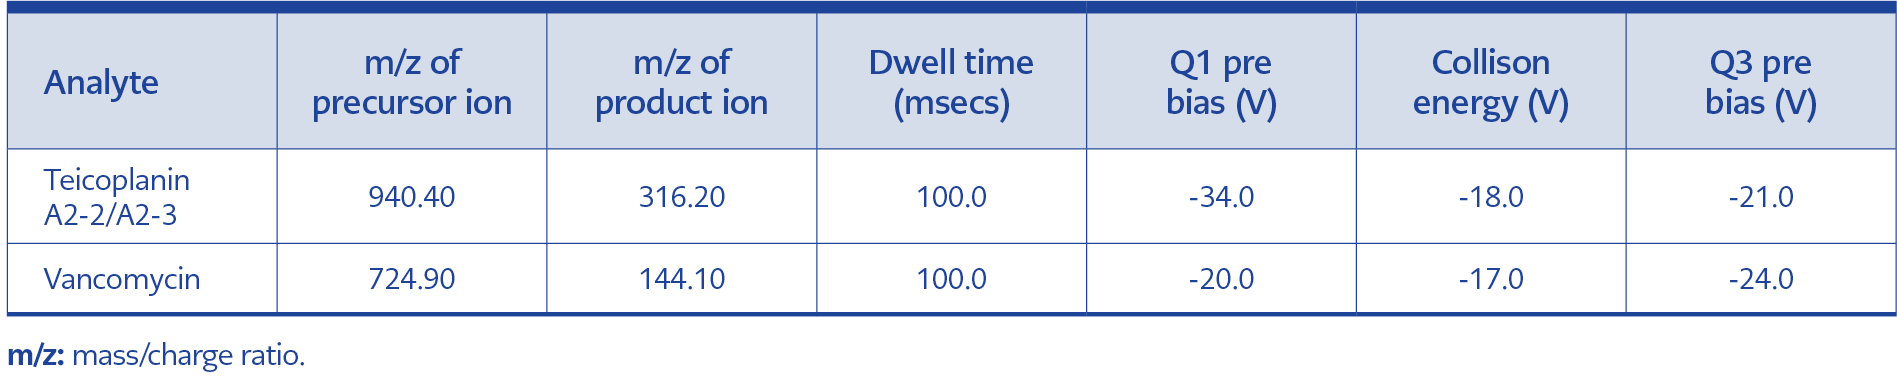
Table 1. The mass spectrometry parameters.
Mass spectrometric detection was performed using an LCMS-8040 instrument (Shimadzu Corp., Kyoto, Japan). The following conditions were set: flow rate of nebulizer gas 3 L/min, desolvation line temperature of 250°C, heating block temperature of 400°C, flow rate of drying gas 15 L/min, collision-induced dissociation gas pressure of 230 kPa. The mass spectrometry parameters are presented in Table 1.
Validation
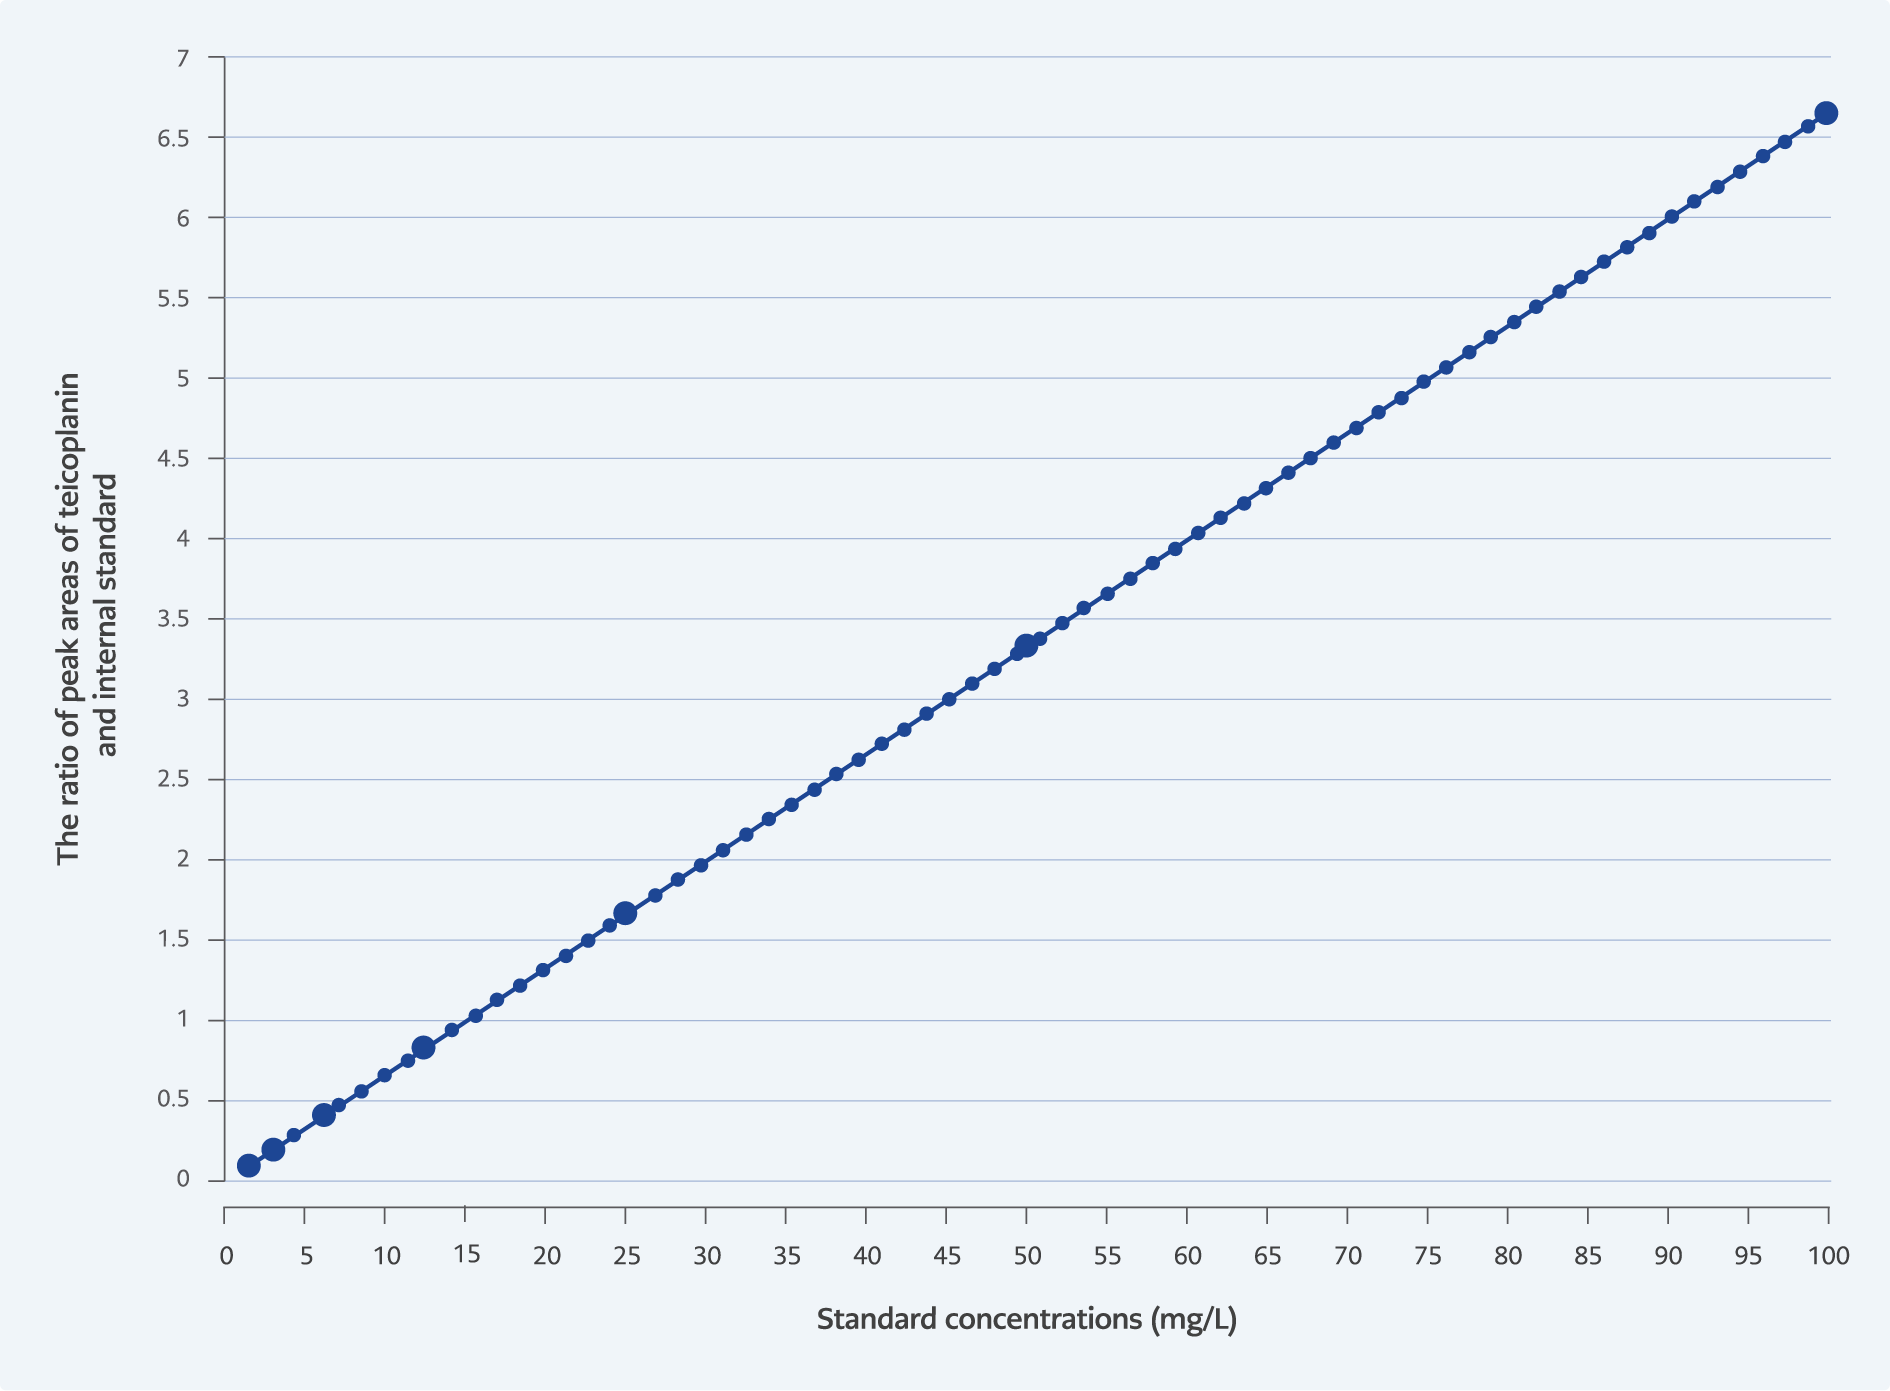
Fügure 1. Standard curve used for quantifying teicoplanin levels in patient plasma samples.
Each standard was analysed two times, and the standard curve was obtained. It was seen that the standard curve was linear between 1.56–100 mg/L concentrations (r2=0.999). The standard curve is given in Figure 1.
The appropriateness of the validation parameters of the method was evaluated according to the U.S. FDA guidance (20). The standard with the lowest concentration (1.56 mg/L) was analysed five times, and the standard deviation was determined. The lower limit of detection (LLOD) and the lower limit of quantification (LLOQ) were calculated by multiplying this value by 3.3 and 10, respectively. The LLOD and LLOQ values for the method were found to be 0.33 mg/L and 1.00 mg/L, respectively.
The precision and accuracy of the method were evaluated by analysing three different teicoplanin concentrations—3.13, 25, and 100 mg/L—five times on three separate days. For intraday precision and accuracy, the standards were analysed five times consecutively. The analysis was repeated five times on three different days for inter-day precision and accuracy. Precision and accuracy were determined by relative standard deviation (RSD, %) and bias (%), respectively. Appropriate precision and accuracy were defined as an RSD not exceeding 20% and a bias within ±20%. For each concentration, the precision values ranged from 0.01% to 0.12% for intraday and 0.04% to 0.12% for inter-day measurements, while the accuracy values ranged from -0.29% to 9.56% for intraday and 1.88% to 8.28% for inter-day measurements, all of which were considered appropriate.
The method’s recovery rate (%) was evaluated by mixing of 25 mg/L and 100 mg/L standards in equal volumes, and the expected analyte concentration was assumed to be 62.5 mg/L. The measured analyte concentration was found to be 62.44 mg/L, which yields a recovery rate of 99.91%. This recovery rate could be evaluated as appropriate (80%–120%).
The carry-over effect was evaluated using standards with concentrations of 6.25 mg/L and 100 mg/L. The difference between the readings of the 6.25 mg/L concentration before and after the measurement of 100 mg/L concentration was assessed. It was concluded as appropriate because the difference, which was 0.02 mg/L, was smaller than LLOD, which was determined to be 0.33 mg/L.
Teicoplanin Treatment
Teicoplanin treatment was administered to patients in two phases: a loading phase followed by a maintenance phase in accordance with the manufacturer’s package insert. The first three doses of teicoplanin were administered intravenously in 400 mg units every 12 hours. The loading dose was given regardless of the patient’s current renal function. The maintenance dose of teicoplanin was administered intravenously in units of 400 mg once daily in patients with normal renal function. The maintenance teicoplanin dosing interval was extended to 48 hours if the patient’s estimated creatinine clearance (eCrCl) was between 30–60 mL/min, and to 72 hours if it was below 30 mL/min.
Statistical Analysis
There were no missing data in the analysis. All statistical analyses were performed using the Statistical Package for the Social Sciences (SPSS), version 27.0.1 (IBM Corp., USA). Continuous variables were expressed as median (interquartile range [IQR]) and categorical variables were presented as counts (percentages). Given the relatively small sample size, normality tests were not conducted, and non-parametric tests were used. Comparisons of the median values of two continuous variables were conducted using the Mann-Whitney U test. Comparisons among more than two continuous variables were performed using the Kruskal-Wallis H test. Paired comparisons of continuous variables (before and after the treatment) were analysed using the Wilcoxon signed-rank test. Paired comparisons of categorical variables (before and after the treatment) were done using the McNemar test. The distribution of the two categorical data was analysed using Fisher’s exact test. Univariate analyses were performed to identify the predictors that could significantly contribute to the teicoplanin target trough-level attainment. In the univariate analyses, the predictors that reached a p-value of 0.15 or less were included in the multivariate analysis. A p-value <0.05 was considered statistically significant.
Results
This study developed and validated an LC-MS/MS method for determining teicoplanin plasma levels according to U.S. FDA guidelines. The quantification method demonstrated a broad linearity range (1.56–100.0 mg/L) with LLOD of 0.33 mg/L and LLOQ of 1.00 mg/L. The method was suitable for use in TDM laboratories with a runtime of 5.5 minutes.
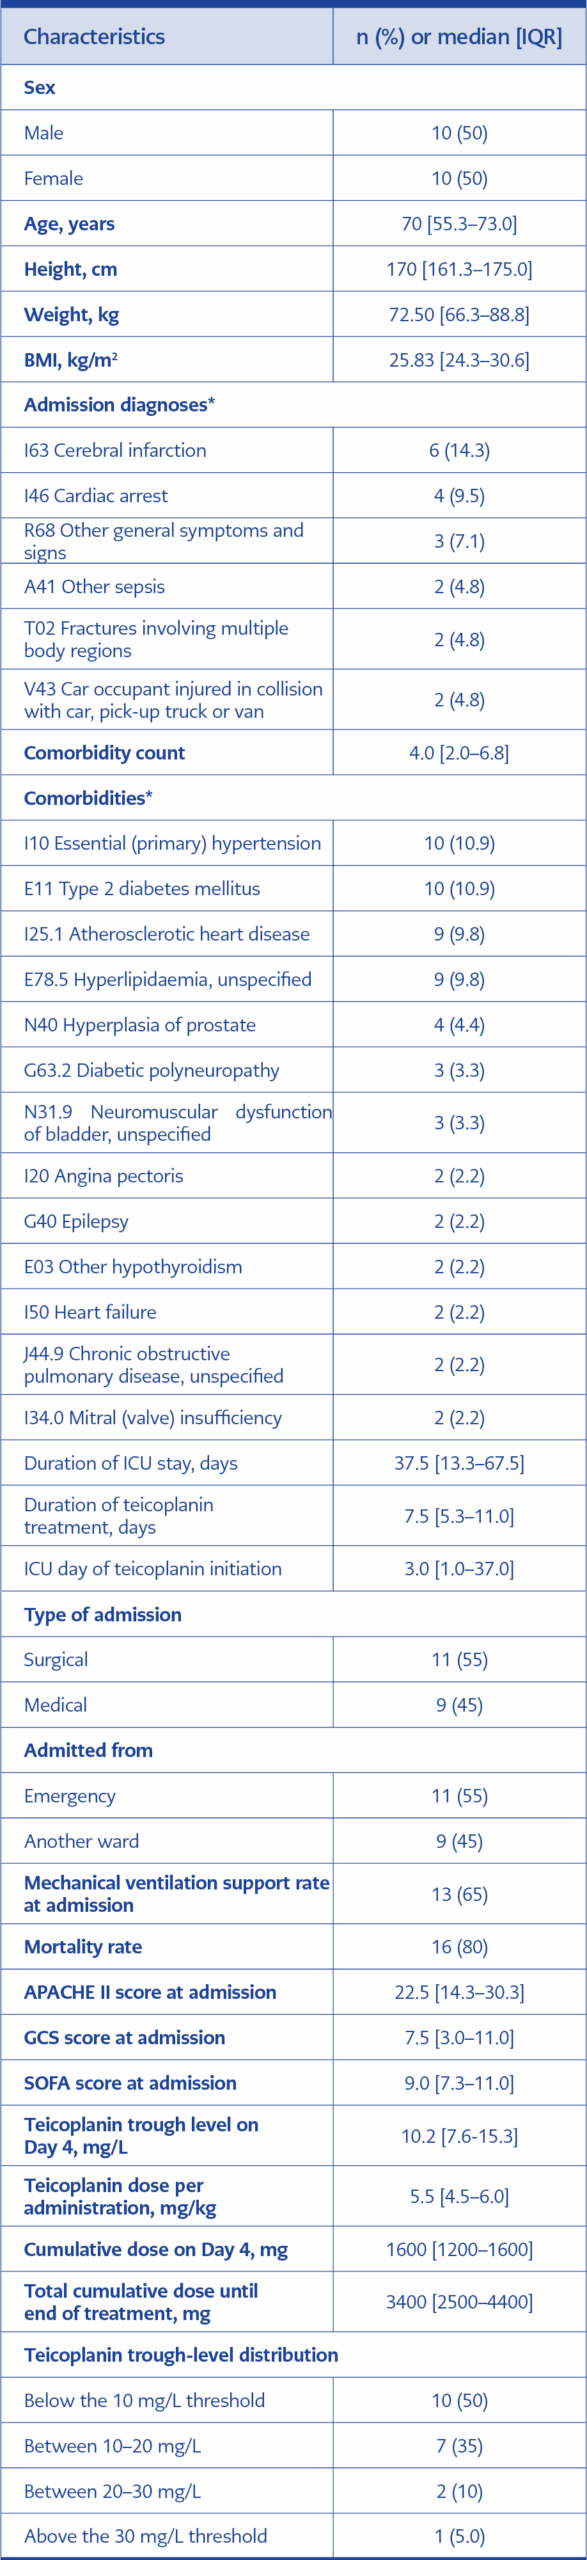
Table 2. Demographic, clinical, and treatment characteristics of the patients (n=20).
A total of 20 critically ill patients were included in the study. Of these, 17 (85.0%) patients were from the ICUs of İnönü University Turgut Özal Medical Centre and 3 (15.0%) patients were from Erciyes University Gevher Nesibe Hospital. The characteristics of the study population are presented in Table 2. With a 5.5 [4.5–6.0] mg/kg unit teicoplanin doses, 50.0% of the patients had reached target teicoplanin trough level of 10 mg/L by the fourth day of treatment.
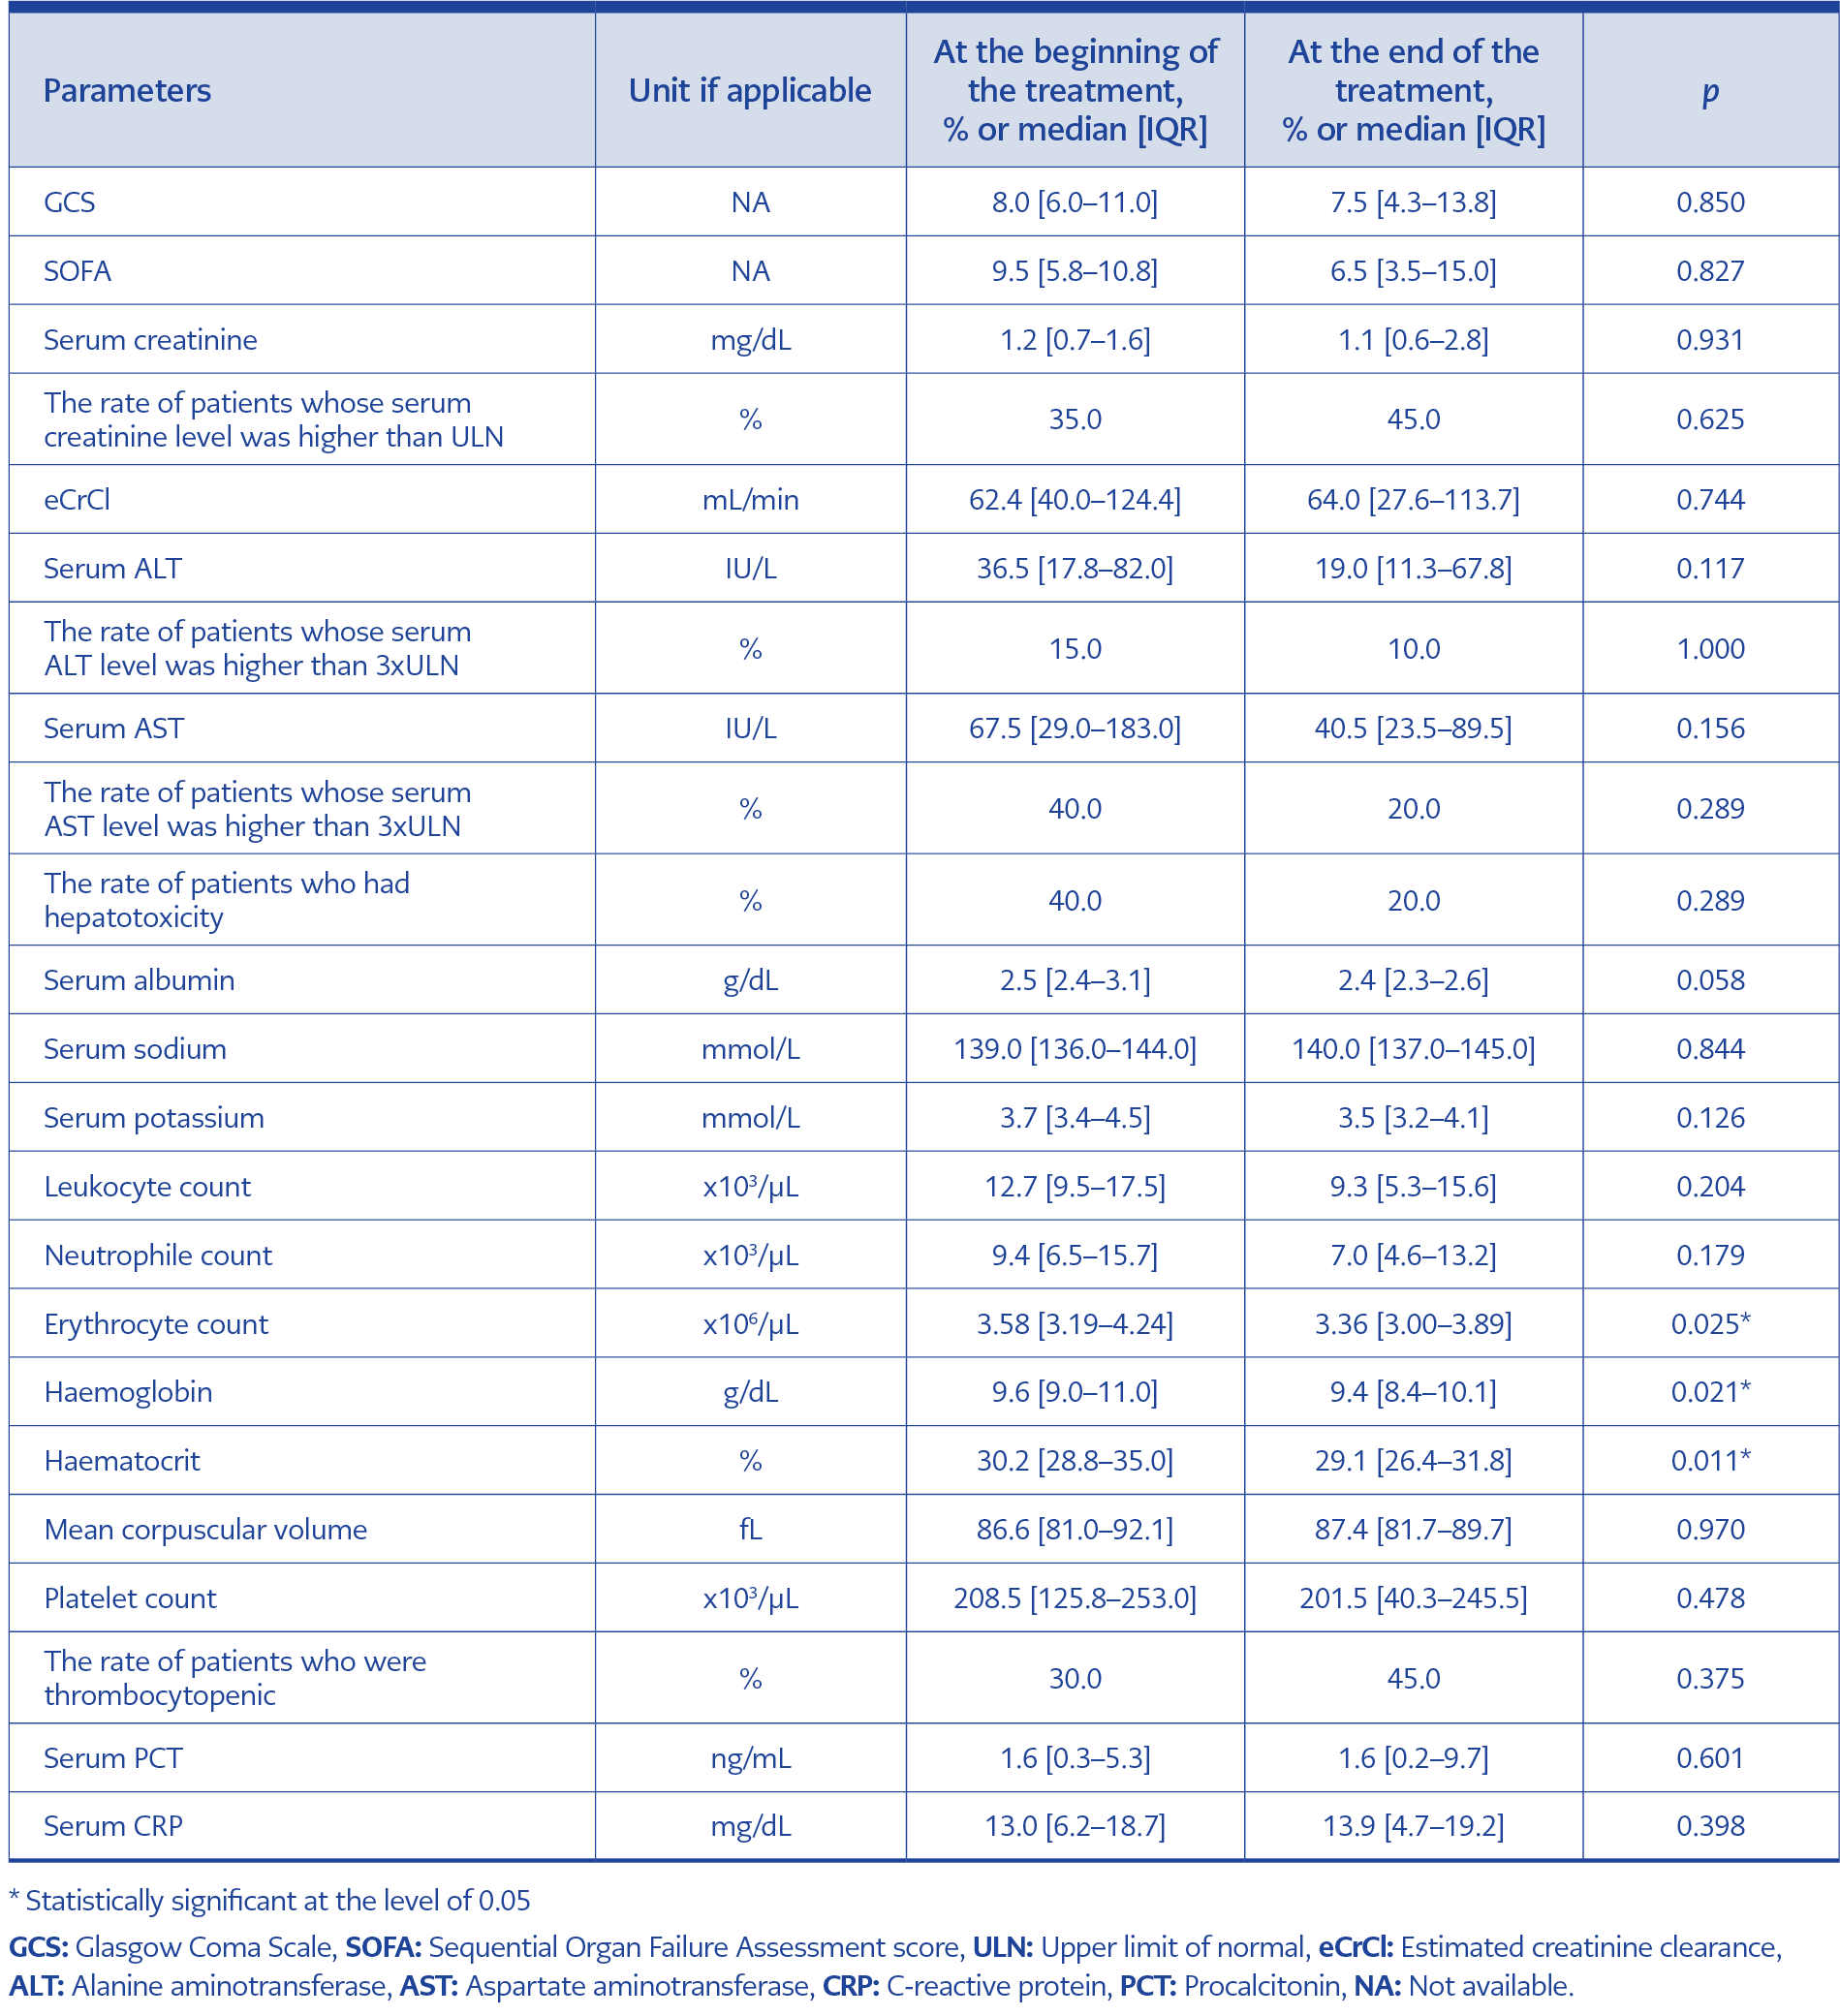
Table 3. Changes in selected clinical and laboratory parameters during teicoplanin treatment (n=20)
Some laboratory parameters, clinical scores, and rates of some medical conditions were compared before and after teicoplanin treatment. The results are presented in Table 3. No significant changes were observed in laboratory values at the end of the treatment compared to baseline, except for erythrocyte counts, haemoglobin levels, and haematocrit values, which significantly decreased (p=0.025, 0.021, and 0.011, respectively).
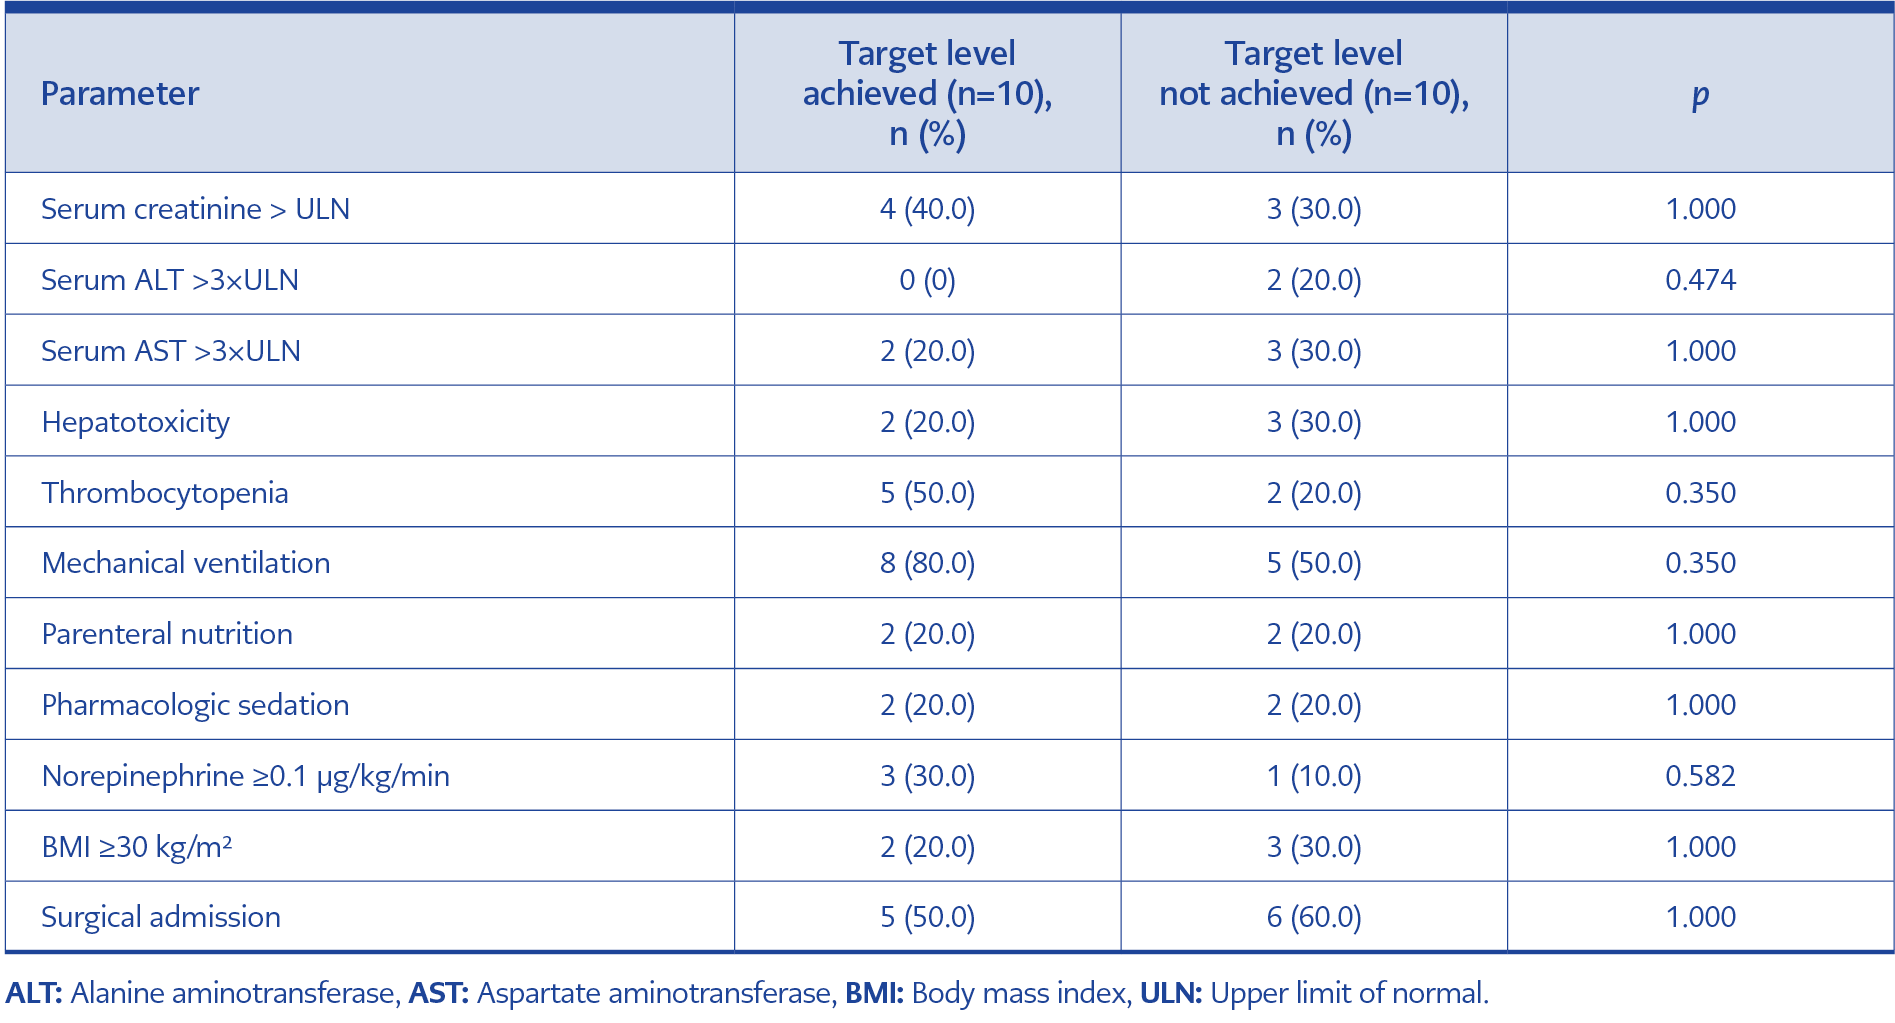
Table 4. Comparison of clinical parameters on Day 4 between patient groups.
The distribution of some patient-related parameters and medical conditions on the fourth day of the teicoplanin treatment, stratified by whether patients reached the target teicoplanin trough level, is given in Table 4.
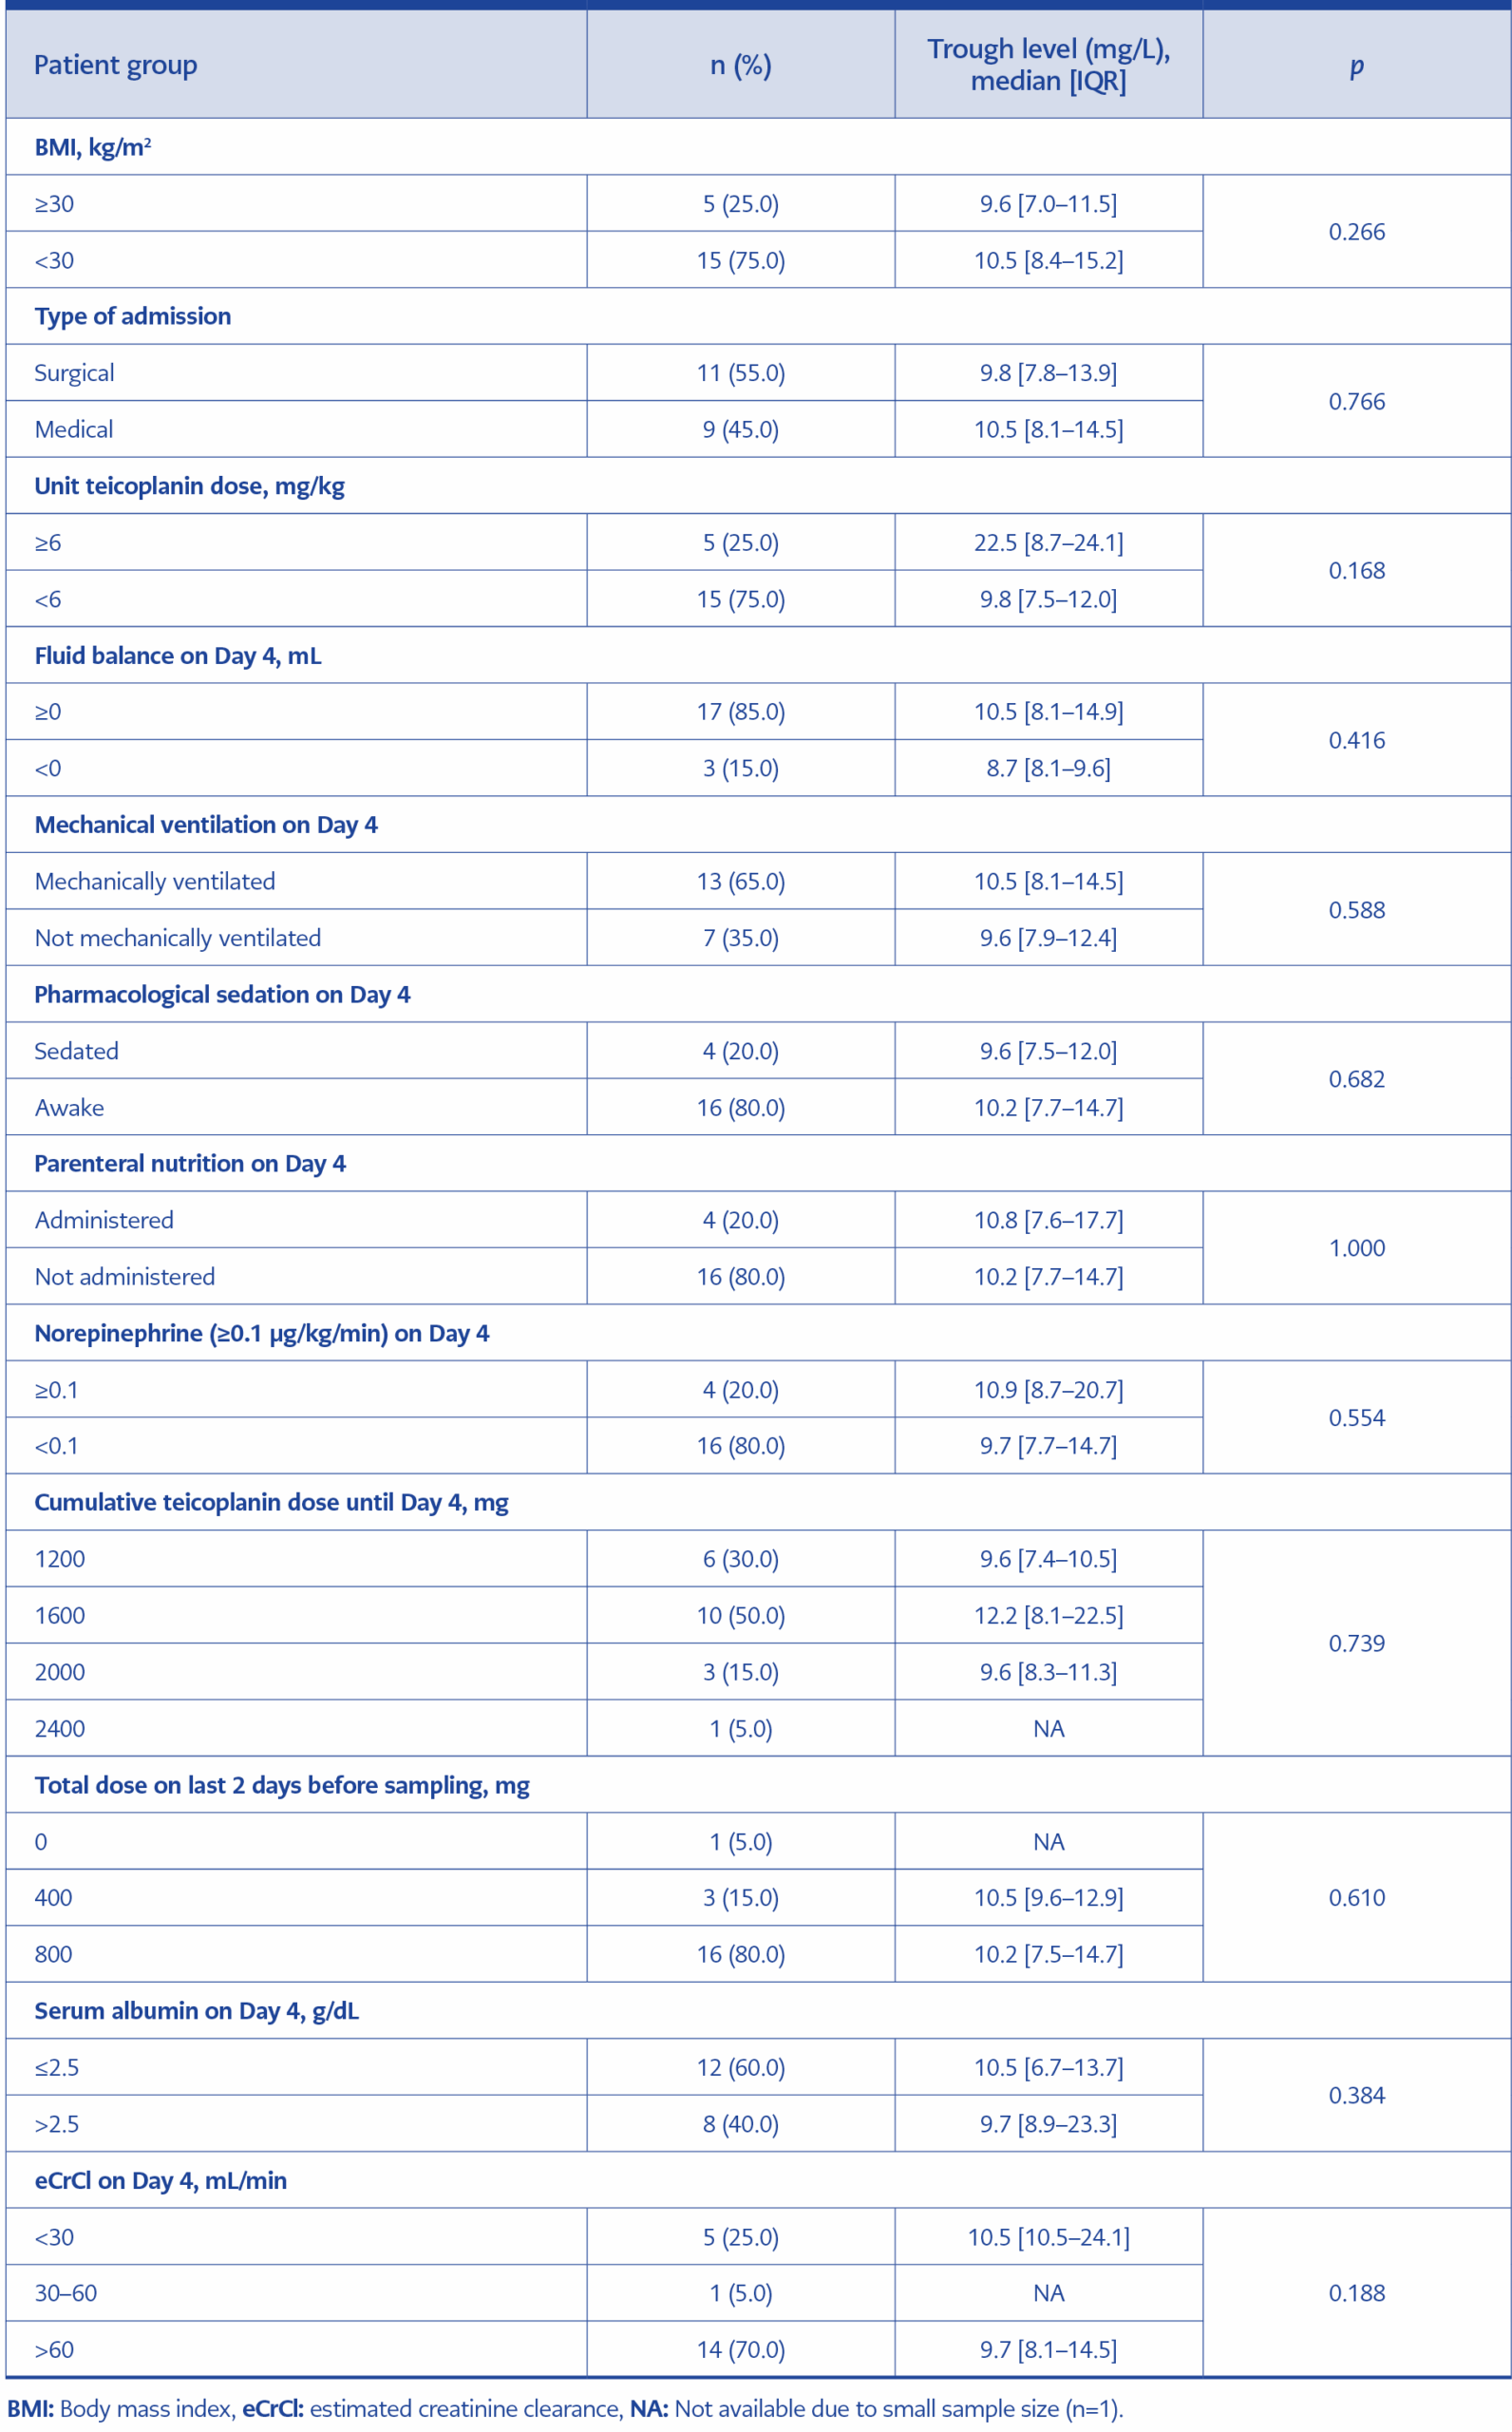
Table 5. The comparison of teicoplanin trough levels on Day 4 of treatment among the patient subgroups.
Median teicoplanin trough levels were compared across various patient groups, as detailed in Table 5. The patients were grouped based on their eCrCl on the fourth day of the treatment: <30 mL/min, 30–60 mL/min, and >60 mL/min. No significant difference in median teicoplanin trough level was observed among the groups (p=0.188). Similarly, there was no difference in median teicoplanin trough levels between patients with serum albumin levels ≤ 2.5 g/dL and those with >2.5 g/dL on the fourth day of treatment (p=0.384).
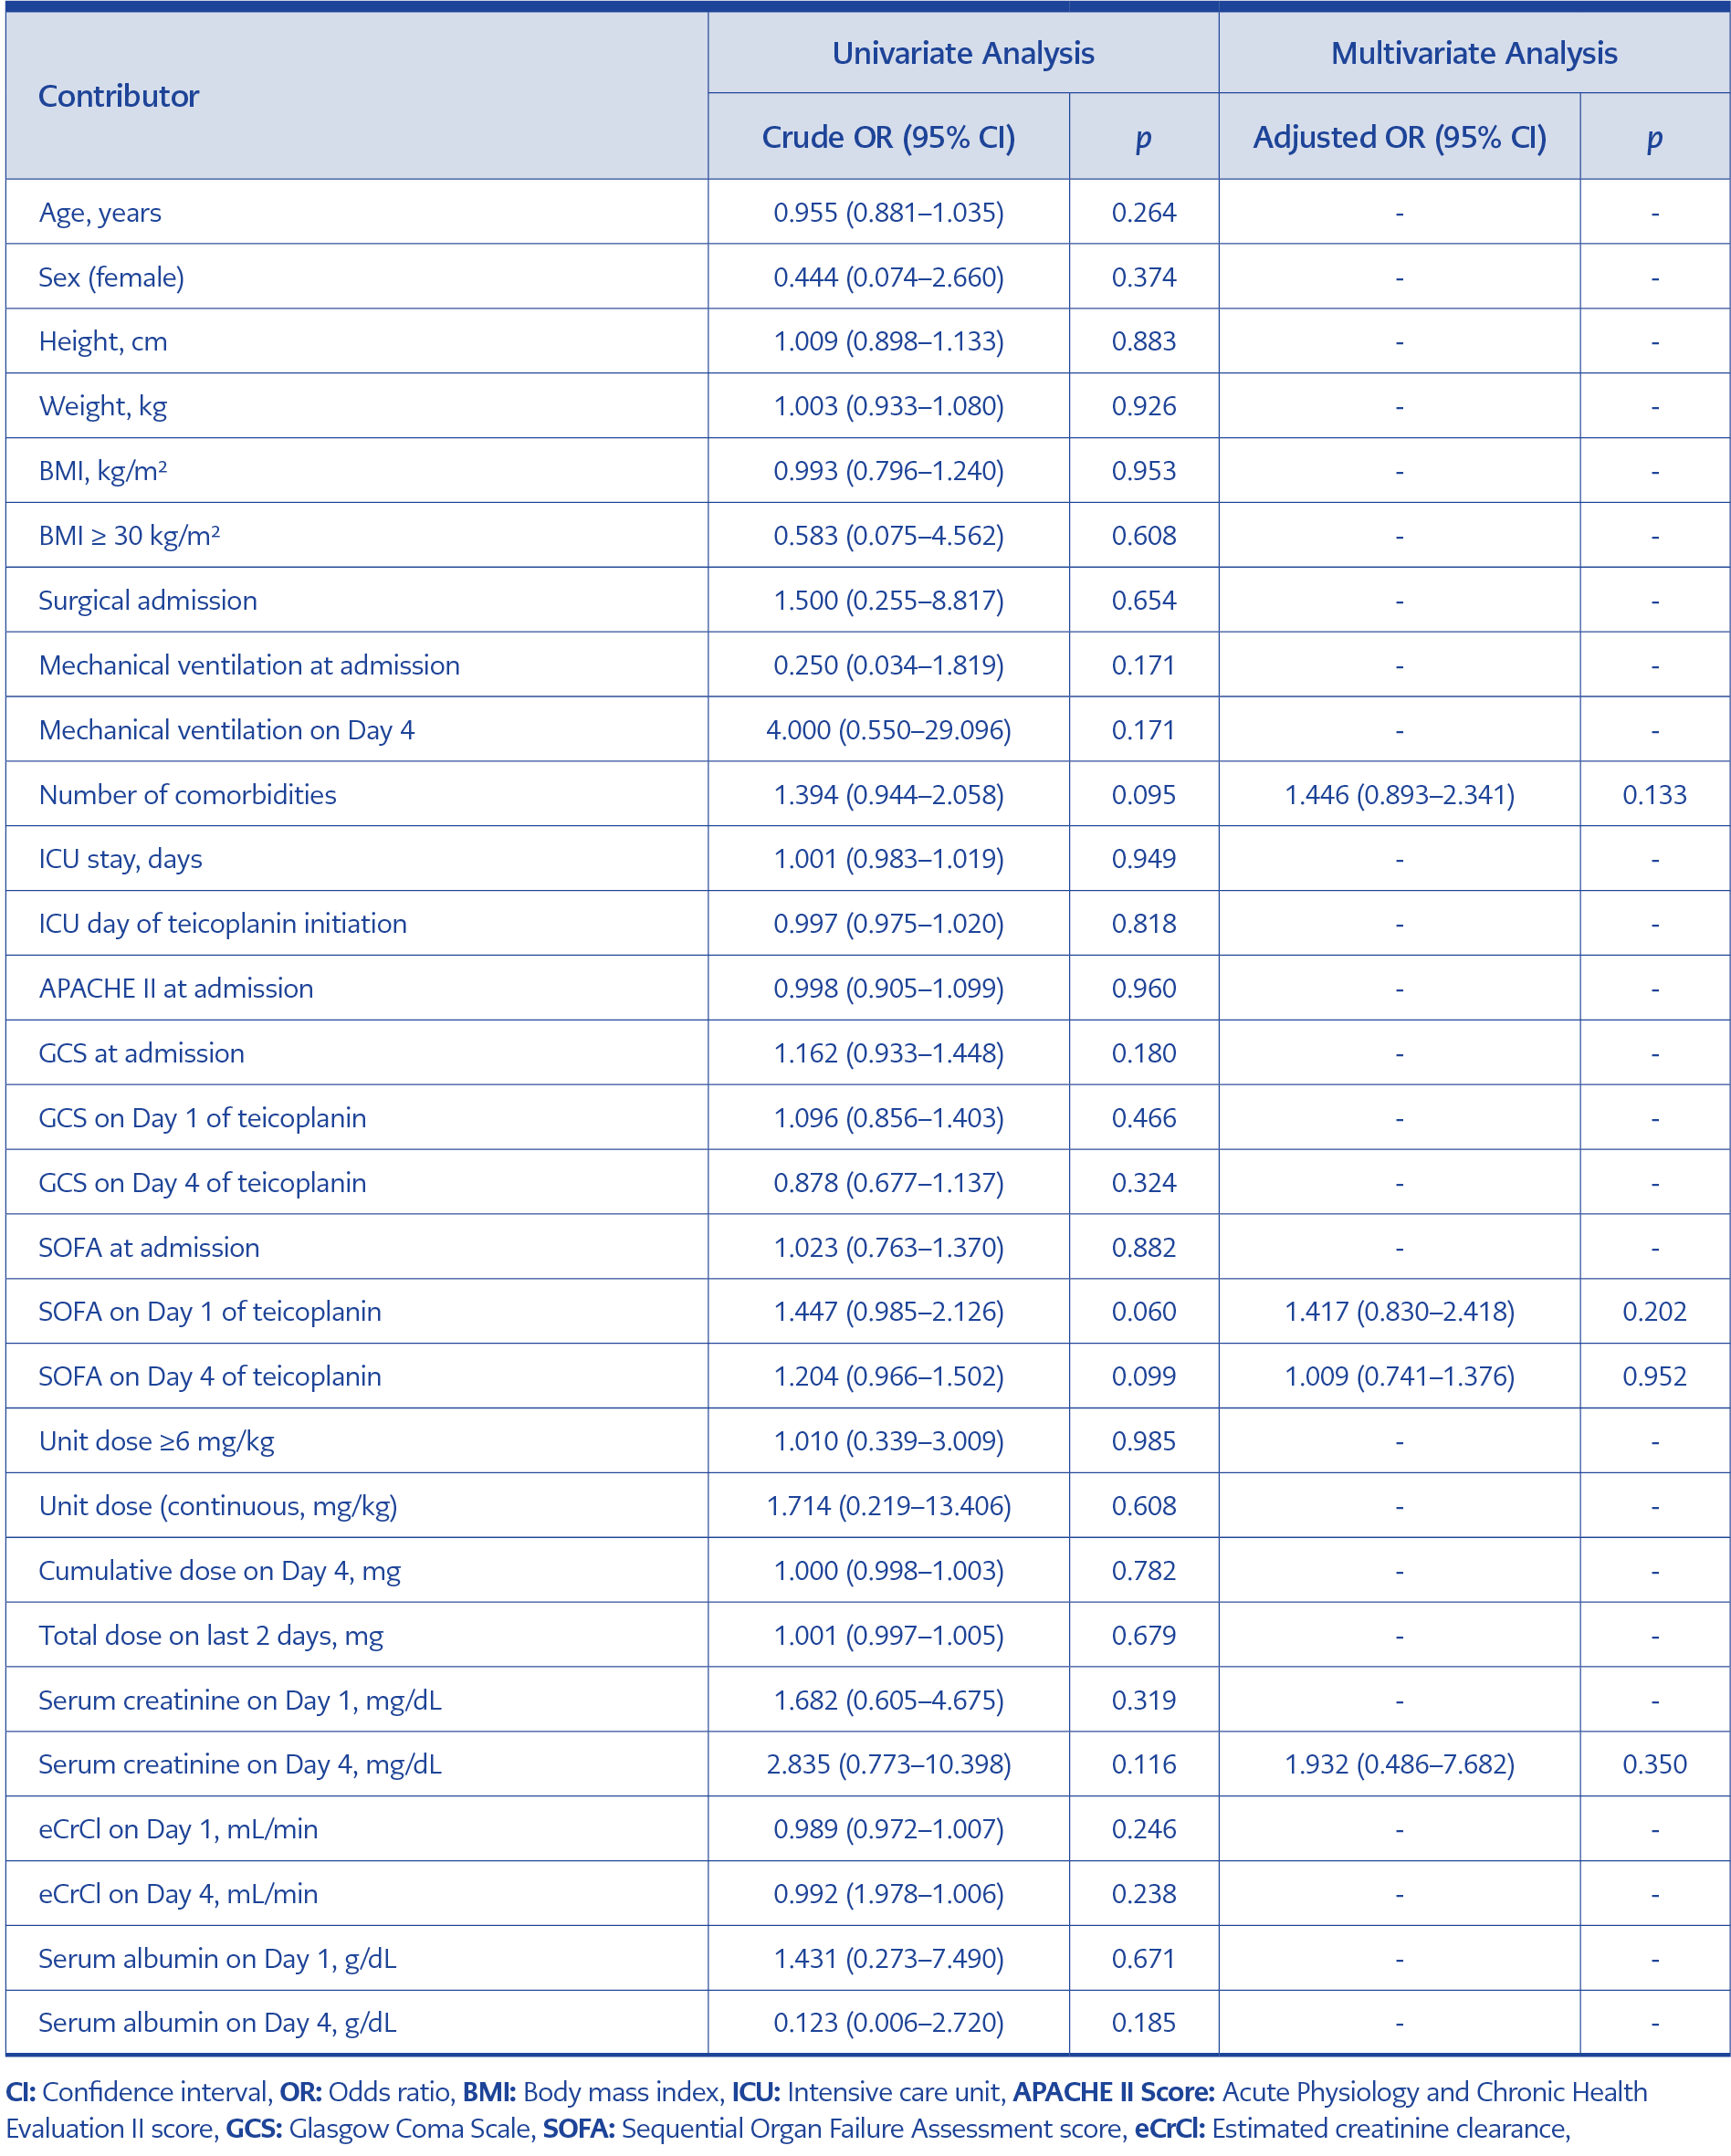
Table 6. The univariate and multivariate logistic regression analysis of the teicoplanin target trough level attainment.
Univariate and multivariate analyses were performed to identify the significant predictors of achieving the target teicoplanin trough level. The results are presented in Table 6.
Discussion
The LC-MS/MS assay validated in this study is high-throughput, robust, and sufficiently rapid for implementation in clinical TDM laboratories. The assay does not require deuterated-teicoplanin as an internal standard; instead, it uses non-isotope-labelled vancomycin, offering a more economical alternative. The method is linear between 1.56–100 mg/L of teicoplanin concentrations, encompassing therapeutic levels.
Chae et al. (21) developed an LC-MS/MS assay for teicoplanin in 104 patients with hematologic malignity. Their method was linear between 3.9-52.9 mg/L of teicoplanin concentrations, which is narrower. Mouton et al. (22) developed an LC-MS/MS assay that could be used to measure the total and free fraction of teicoplanin in 30 ICU and haematological patients. Their method could quantify a minimum teicoplanin level of 2.5 mg/L in blood. However, our method could quantify a minimum teicoplanin level of 1 mg/L in blood which is more sensitive. In addition, the assay method of Mouton et al. (22) has a linearity in a range of 2.5–150 mg/L, which is wider than ours. Barco et al. (23) developed an assay that could quantify 14 antibiotics simultaneously in critically ill pediatric patients. Our assay method, however, cannot quantify anything other than teicoplanin, making it more labour-intensive in TDM settings where more than one drug level needs to be monitored simultaneously.
Many different dosing regimens have been tried in the literature, and the proportion of patients achieving different target teicoplanin trough levels has been analysed. We believe that these differences are due to several factors ranging from patient demographics to renal function. In fact, in the study conducted by Li et al. (24), the CrCl of the patient group in which 400 mg unit teicoplanin dose was administered was reported as 93 (26.8-146.3) mL/min, and the rate of patients whose trough level exceeded 10 mg/L was 28.6%. In this study, a 400 mg unit dose of teicoplanin was administered, and the CrCl of the patients was found to be 73.2 (30.4–126.1) mL/min, while the rate of patients with trough levels exceeding 10 mg/L was 50.0%. Since teicoplanin is mainly excreted by the kidneys, it accumulates in the body and reaches higher concentrations in the case of renal failure. One reason for the higher rate of patients reaching the target teicoplanin trough level in this study compared to Li et al. (24) may be that our patient group had worse renal function. This explains how we reached the target level in half of the patients in this study, even though a unit dose of teicoplanin lower than 6 mg/kg was administered.
The rate of hepatotoxicity before and after teicoplanin treatment was not significantly different (p=0.289). Similarly, a retrospective study conducted by Kato et al. in 2016 (25) assessed hepatotoxicity in 42 patients who were divided into three groups based on the teicoplanin loading dose they received: Group 1 (n=5) received approximately 40 mg/kg for two days, Group 2 (n=19) received approximately 35 mg/kg for two days, and Group 3 (n=18) received approximately 30 mg/kg for two days. Hepatotoxicity was observed in 20% of patients in Group 1, 21.1% in Group 2, and 16.7% in Group 3, but statistical significance was not reached across the groups (p=0.48).
In our study, the proportion of patients with serum creatinine values exceeding the upper limit of the normal limit before and after teicoplanin treatment did not differ significantly (p=0.625). In a study conducted by Ueda et al. (26) in 2014, patients were divided into four groups according to teicoplanin trough levels, and the rates of patients with nephrotoxicity were analysed. Nephrotoxicity was not observed in any patients with trough levels below 10 mg/L or above 30 mg/L. However, it was observed in 1.6% of patients with trough levels between 10–15 mg/L and in 3.2% of those with levels between 15–30 mg/L. The differences between the groups were not statistically significant (26). The relatively small sample size in this study should also be taken into account when interpreting the results.
In our study, the eCrCl values of the patients were calculated using the Cockcroft-Gault formula based on the serum creatinine values measured on the fourth day of teicoplanin treatment. The patients were divided into three groups: those with an eCrCl value <30 mL/min, between 30–60 mL/min, >60 mL/min. The distribution of teicoplanin trough levels among these groups was analysed. Statistical analysis revealed no significant difference in plasma teicoplanin trough levels between the groups (p=0.188). This finding may be attributed to the fact that teicoplanin maintenance doses were adjusted based on renal function, which likely contributed to achieving consistent blood drug levels across all groups.
In a study published by Ueda et al. (12) in 2020, the effects of several variables on the attainment of a first teicoplanin trough level of below or above 20 mg/L were examined. The study found that having a BMI of ≥25 kg/m2 (p=0.008), receiving an enhanced teicoplanin dosing regimen (p<0.001), staying in the ICU for longer than three days (p<0.001), having serum albumin <2.5 g/dL (p<0.001), undergoing surgical operation within the previous 28 days (p=0.001), and receiving parenteral nutrition (p=0.022) were all significantly associated with a first teicoplanin trough level of ≥20 mg/L. In contrast, ventilator use (p=0.316), eGFR ≥ 60 mL/min/1.73 m² (p=0.603), the presence of chronic renal failure (p=0.062), and an APACHE II score ≥ 15 (p=0.371) were not significantly associated with teicoplanin trough levels (12). Similarly, in another study published in 2020, Li et al. (24) examined the factors that could influence attainment of a teicoplanin trough level of 10 mg/L. The study found that the body weight of the patient as the only statistically significant factor (p<0.001). In our study, we also investigated factors that could influence attainment of a teicoplanin trough level of 10 mg/L; however, no factors reached statistical significance in the multivariate analysis.
We found a significant decrease in erythrocyte (p=0.025), haemoglobin (p=0.021), and haematocrit (p=0.011) values at the beginning and the end of teicoplanin treatment. In the ICU, patients may develop anaemia due to many reasons. However, a review of the literature did not establish a relationship between teicoplanin and these parameters. To draw more definitive conclusions, further studies with larger number of participants and studies specifically focused on this issue are necessary.
This study has several limitations. It did not assess the clinical and microbiological success of teicoplanin treatment, nor did it examine the association with teicoplanin trough level. Additionally, the study could not provide sufficient evidence on the impact of extracorporeal therapies, such as renal replacement therapy, on teicoplanin trough levels due to the limited number of eligible patients. TDM of teicoplanin was not performed on the day that blood samples were collected; therefore, teicoplanin treatment was not adjusted based on the trough levels. As a result, the study cannot infer the effect of TDM-led therapy modifications on clinical success. The LC-MS/MS method used in this study was validated to measure total teicoplanin concentrations. It remains unknown whether the method is suitable for quantifying the unbound fraction of teicoplanin in human plasma. However, routine TDM of the unbound fraction is not currently recommended in clinical guidelines.
One of the strengths of this study is that the teicoplanin plasma trough levels were determined with sufficient precision by using a sensitive, rapid, low-cost, and practical LC-MS/MS method. Furthermore, this study contributes to the field by identifying key gaps and providing a validated method that may support future TDM studies on teicoplanin.
In this study, a robust, high-throughput, and rapid LC-MS/MS method suitable for TDM of teicoplanin was successfully developed and validated for use in clinical laboratories. Further large-scale studies are needed to clarify the relationship between teicoplanin trough levels and patient-related factors. Additionally, the concentration-time profile of teicoplanin in the context of extracorporeal therapies, such as renal replacement therapy, is another area for future investigation.